Finding the correct extrema and end behavior answers requires a clear, systematic approach to analyzing polynomial and rational functions. If you're stuck on a homework problem or studying for an exam, you don't need vague theory. You need exact methods to find local maximums, minimums, and asymptotic limits without getting bogged down in algebra errors.
Whether you're working through calculus homework or algebra practice sets, mastering these two core graph characteristics guarantees you'll stop losing points on curve sketching and limit problems. Let's break down how to find, verify, and write out correct answers every time.
Finding Extrema: Step-by-Step
Extrema refer to the relative (local) maximum and minimum points on a graph where the function changes direction. To find these values accurately, you need the first derivative.
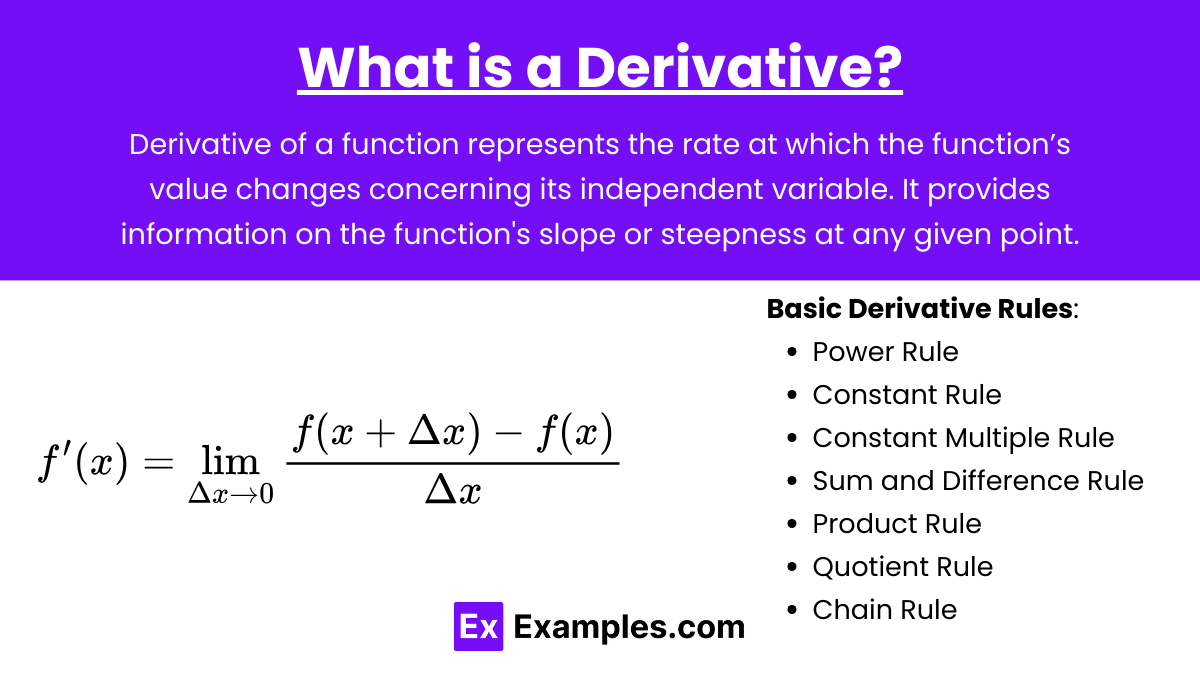
- Take the first derivative of your function, written as $f'(x)$.
- Find critical points by setting $f'(x) = 0$ and identifying any values where $f'(x)$ is undefined.
- Test the intervals around your critical points using test values to check where the derivative changes sign.
- Classify each point: If the derivative switches from positive to negative, you've found a relative maximum. If it switches from negative to positive, it's a relative minimum.
For example, take the function $f(x) = 2x^3 - 6x^2 + 5$.
First, compute the derivative: $f'(x) = 6x^2 - 12x$. Set it to zero and factor: $6x(x - 2) = 0$. Your critical numbers are $x = 0$ and $x = 2$. Testing points in the intervals $(- \infty, 0)$, $(0, 2)$, and $(2, \infty)$ shows that $f(x)$ increases, decreases, then increases. Your answers will show a relative maximum at $(0, 5)$ and a relative minimum at $(2, -3)$.
Decoding End Behavior
End behavior describes what happens to the $y$-values of a function as $x$ heads toward positive or negative infinity ($\pm \infty$). For polynomial functions, you don't need to graph the whole equation. You only need the Leading Term Test.
Look strictly at the term with the highest exponent. The degree (even or odd) and the sign of the leading coefficient dictate the entire end behavior profile.
- Even degree, positive leading coefficient: Both ends point up. As $x \to \infty$, $f(x) \to \infty$, and as $x \to -\infty$, $f(x) \to \infty$.
- Even degree, negative leading coefficient: Both ends point down. As $x \to \infty$, $f(x) \to -\infty$, and as $x \to -\infty$, $f(x) \to -\infty$.
- Odd degree, positive leading coefficient: Falls left, rises right. As $x \to \infty$, $f(x) \to \infty$, and as $x \to -\infty$, $f(x) \to -\infty$.
- Odd degree, negative leading coefficient: Rises left, falls right. As $x \to \infty$, $f(x) \to -\infty$, and as $x \to -\infty$, $f(x) \to \infty$.
For more details on polynomial limits and notation conventions, check out the Paul's Online Math Notes Calculus I Course.
Rational Functions and Asymptotes
When your practice problems switch from polynomials to rational functions—fractions where both numerator and denominator are polynomials—end behavior changes from infinity to horizontal or slant asymptotes.
Compare the degree of the numerator ($N$) to the degree of the denominator ($D$):
- Degree of $N <$ Degree of $D$: The horizontal asymptote is automatically $y = 0$.
- Degree of $N =$ Degree of $D$: Divide the leading coefficients of the numerator and denominator to find your horizontal asymptote $y = a/b$.
- Degree of $N =$ Degree of $D + 1$: There is a slant (oblique) asymptote. Use polynomial long division to divide the numerator by the denominator, ignoring the remainder. The resulting linear equation is your end behavior model.
If you want to practice interactive graphing and check your algebraic work visually, the Desmos Graphing Calculator offers an immediate way to test rational function limits.
Common Mistakes to Avoid
Students often miss points on test questions because of a few recurring errors. Watch out for these traps:
- Confusing coordinates: When asked for extrema answers, make sure you provide the full $(x, y)$ coordinate point rather than just the $x$-value, unless the question explicitly asks "at what $x$-value".
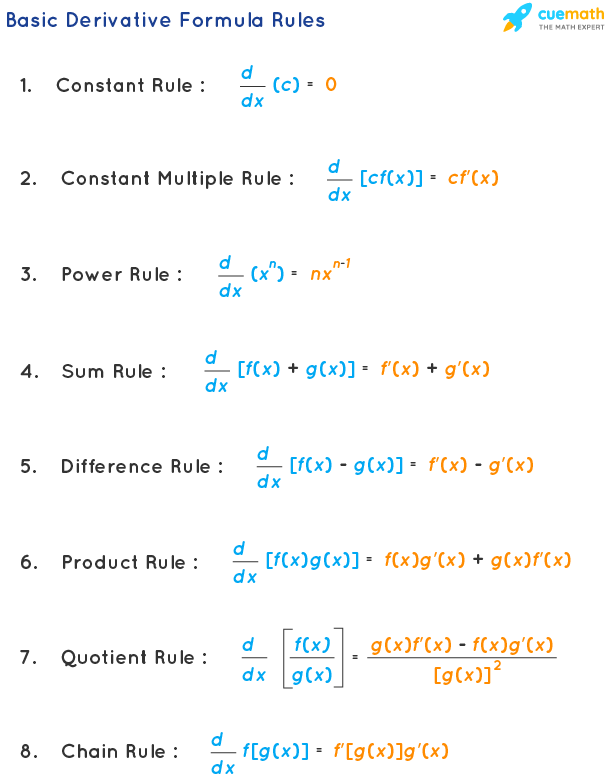
- Ignoring the chain rule: When taking derivatives of polynomials inside parentheses, forgetting to multiply by the derivative of the inner function shifts your critical points entirely.
- Misreading limit notation: Pay close attention to whether a question asks for behavior as $x \to \infty$ versus $x \to -\infty$. Writing $\infty$ when a graph drops downward is an easy way to lose credit.
Frequently Asked Questions
How do I know if my extrema answers are absolute or relative?
Relative extrema are local peaks and valleys within a specific interval. Absolute extrema are the absolute highest and lowest points across the entire domain of the function. To find absolute extrema on a closed interval, you must evaluate your function at both the critical points and the boundary endpoints $x = a$ and $x = b$.
What if my first derivative has no real solutions?
If setting $f'(x) = 0$ yields no real numbers (for instance, $f'(x) = x^2 + 4$), the function has no critical points and therefore no relative extrema. The function is strictly increasing or decreasing across its entire domain.
Can a function cross its horizontal asymptote?
Yes. Horizontal asymptotes describe end behavior as $x$ approaches positive or negative infinity. A rational function can intersect or cross its horizontal asymptote in the middle of the graph near smaller values of $x$ before flattening out to follow it at the extremes.
How do inflection points differ from extrema?
Extrema are points where the graph changes direction from increasing to decreasing (or vice versa). Inflection points are locations where the graph changes concavity (from concave up to concave down, or vice versa), which you find by setting the second derivative $f''(x) = 0$.