Mapping North America took centuries of trial, error, sea voyages, and mathematical adjustments. Early European cartographers drew continents based on sparse traveler tales, coastal guesses, and political ambitions. Today, satellite data gives us pinpoint accuracy, but understanding how those old maps evolved reveals the changing ambitions of the continent's explorers and nations.
If you study a modern map of North America, you're looking at borders and geographic features refined by centuries of geodetic surveys. Early mapmakers didn't have GPS or aerial photography. Instead, they relied on dead reckoning, crude astrolabes, and the accounts of fur traders and Indigenous guides. This history shapes how we view geographic data today.
The Evolution of North American Cartography
The transition from speculative sketches to precise geographic representations didn't happen overnight. European powers needed reliable charts to claim territory, establish trade routes, and navigate treacherous coastal waters.
Early sixteenth-century charts often showed California as an island or miscalculated the width of the continent entirely. Mapmakers like Gerardus Mercator and Martin Waldseemüller compiled data from returning ship captains, but errors compounded quickly. A mistake of a single degree in longitude could shift a coastline by dozens of miles, leading to shipwrecks and lost expeditions.
As inland exploration expanded during the seventeenth and eighteenth centuries, cartographers replaced guesswork with actual traverse surveys. Trappers from the Hudson's Bay Company and French voyageurs mapped river systems like the Mississippi and the St. Lawrence, providing the skeleton for future interior maps.
Key Eras in Continental Mapping
Different centuries brought distinct methodologies to North American cartography.
- The Age of Discovery (1500–1650): Focused primarily on coastal outlines, safe harbors, and mythical waterways like the Northwest Passage. Inland areas remained blank spaces filled with artistic drawings of wildlife or native settlements.
- The Imperial Competition (1650–1800): British, French, and Spanish mapmakers vied for dominance. Maps from this era heavily politicized boundaries, often exaggerating territorial claims to assert ownership over disputed river basins.
- The Scientific Survey Era (1800–1900): Governments established official agencies, such as the United States Coast Survey and the Geological Survey of Canada. Triangulation methods and standardized prime meridians transformed mapmaking into a rigorous science.
- The Digital and Aerial Revolution (19th Century–Present): Aerial photography in the mid-twentieth century followed by satellite remote sensing replaced manual land chaining with pixel-based spatial data.
How Map Projections Alter Perception
Every flat map of North America distorts reality because you can't flatten a three-sphere without stretching something. The choice of map projection changes how we perceive scale, distance, and geopolitical importance.
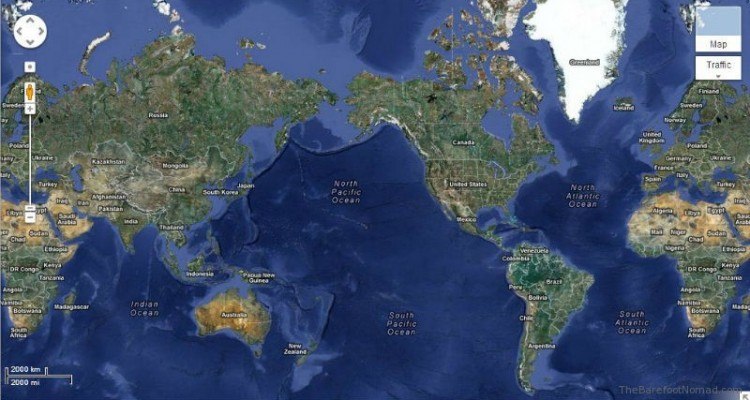
The Mercator projection, famously used in many classroom maps, exaggerates landmasses far from the equator. On a Mercator map, Greenland appears comparable in size to the entire continent of Africa, even though Africa is roughly fourteen times larger. This distortion historically magnified the perceived dominance of northern nations.
Equal-area projections, such as the Peters projection, correct this size distortion but warp the shapes of countries and coastlines. Modern Geographic Information Systems (GIS) software allows cartographers to switch projections instantly depending on whether the user needs accurate navigation, precise area calculations, or correct directional bearings.
Common Misconceptions About Historical Maps
When studying old maps of North America, modern readers often misinterpret the intent behind the cartography. Mapmakers weren't just recording facts; they were often selling a vision to monarchs or investors back in Europe.
- Myth: Old maps were simply primitive. Many historical charts displayed astonishing accuracy in coastal profiling given the navigational tools available at the time. The errors usually lay in longitude calculation, which couldn't be measured reliably until the marine chronometer was invented in the eighteenth century.
- Myth: Blank spaces meant nothing was there. When cartographers left the interior blank or wrote "unexplored," it simply meant European explorers hadn't documented it yet. Indigenous populations had maintained mental and physical maps of these lands for millennia.
- Myth: Borders on colonial maps represent actual control. Boundary lines drawn by European kings often crossed rugged mountain ranges and sovereign Indigenous territories where colonial governments held zero actual administrative power.
Frequently Asked Questions
Why did early maps show California as an island?
A geographical misconception originating from a 1601 Spanish exploration led cartographers to believe the Gulf of California connected to the Pacific Ocean north of the continent. This myth persisted on European maps for over a century until royal decrees and further expeditions disproved it.
How did explorers calculate longitude before modern clocks?
Before accurate marine chronometers, sailors used tedious methods like the lunar distance technique, measuring the angular distance between the moon and certain stars, or relied on celestial events like Jupiter's moon eclipses. These calculations required clear night skies and intense mathematical processing.
What role did Indigenous peoples play in early North American maps?
European explorers relied heavily on local geographic knowledge. Indigenous guides drew detailed maps on bark, animal hides, and sand, showing portages, water sources, and tribal territories. Explorers like Lewis and Clark incorporated this critical data into their journals and published maps.
Why do modern digital maps still use projections?
Even though we store spatial data in three-dimensional coordinates using systems like USGS National Geospatial Program, screens and paper sheets are flat. Projections provide the mathematical bridge needed to render a globe onto a two-dimensional interface without breaking the underlying spatial database.