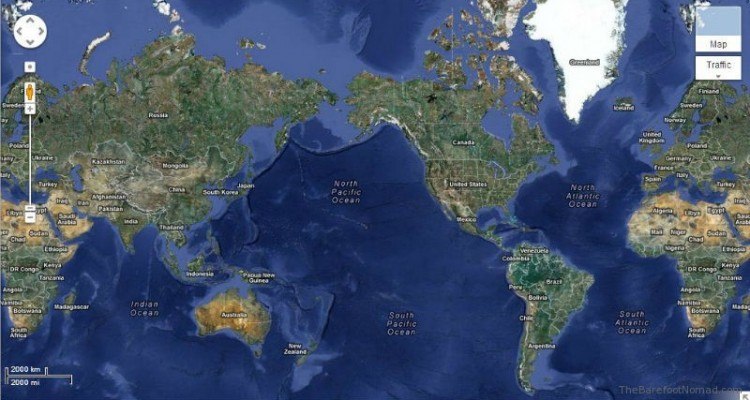
Every flat world map you've ever seen is a distortion. Flattening a three-dimensional sphere onto a two-dimensional piece of paper requires stretching, tearing, or shrinking geographic features. For centuries, the Mercator projection—designed in 1569 for marine navigation—dominated classrooms, textbooks, and wall maps. It made Greenland look as large as Africa and inflated North America while shrinking landmasses near the equator. The Gall-Peters map emerged as a deliberate counter-narrative, sacrificing shape accuracy to preserve proportional land sizes and challenge Eurocentric worldviews.
Understanding how this cylindrical equal-area projection works requires looking past its visual quirks to examine the intersection of geography, politics, and human perception. While cartographers have debated its aesthetic merits for decades, its cultural impact remains undeniable.
Origins of the Projection: James Gall and Arno Peters
The history of the map is split between a 19th-century Scottish clergyman and a 20th-century German historian. In 1855, James Gall presented a cylindrical projection that he called the "orthographic" map. He wanted a map that could show areas in correct proportion to one another. Gall’s work went largely unnoticed by the broader scientific and academic community at the time.
More than a century later, in 1973, German filmmaker and historian Arno Peters independently promoted a nearly identical projection. Peters didn't present his map as a quiet mathematical exercise; he launched it with a press conference, claiming he had invented an entirely new, "democratic" map that corrected the imperialist biases of existing world maps.
The cartographic establishment pushed back hard against Peters' marketing claims and his dismissal of historical precedent, leading to the infamous "map wars" of the late 20th century. Despite the academic friction, the name Gall-Peters map stuck, bridging the 19th-century mathematical description with its late 20th-century political renaissance.
How the Gall-Peters Map Works Mathematically
To understand what makes the Gall-Peters projection unique, you have to look at its underlying geometry. It is a cylindrical equal-area projection.
Imagine wrapping a paper cylinder around a globe, touching it at the equator. If you project the features of the globe onto that cylinder and then unroll it, you get a rectangular grid.
- Equal-Area Preservation: The defining feature of the Gall-Peters map is that a square centimeter anywhere on the map represents the exact same land area ratio on the Earth's surface. If Africa is roughly fourteen times larger than Greenland in reality, it occupies fourteen times more space on a Gall-Peters map.
- Latitude Scaling: To maintain this strict proportional area, the map compresses landmasses horizontally near the equator and stretches them vertically as you move toward the poles.
This mathematical trade-off means that while you gain an honest representation of relative size, you lose the local angles and shapes that navigators rely on.
The Mercator Contrast: Why Size Perception Matters
Most people grow up visualizing the world through the lens of Gerardus Mercator’s 16th-century creation. Mercator designed his map so that any straight line drawn on it represents a constant compass bearing. For sailors navigating open oceans in the age of sail, this was a lifesaver.
However, maintaining those directional angles requires distorting scale. As latitude increases toward the poles, the map stretches landmasses outward in all directions. This creates massive visual distortions:
- Greenland vs. Africa: On a standard Mercator map, Greenland looks roughly equal in size to the entire continent of Africa. In reality, Africa is about fourteen times larger than Greenland.
- Europe and North America: The Global North appears bloated, dominating the visual weight of the planet.
- The Global South: Regions near the equator—including India, Southeast Asia, and South America—look artificially small, subtly reinforcing outdated geopolitical hierarchies.
When educational institutions and media outlets default to Mercator, viewers unconsciously absorb the idea that northern landmasses are the center of planetary importance.
Criticisms and Cartographic Limitations
While the Gall-Peters map succeeded in shifting size awareness, professional cartographers have long criticized it for several valid reasons.
- Severe Shape Distortion: Because the map stretches features vertically near the poles, continents look elongated and bizarre. Antarctica appears less like a continent and more like an enormous white band frozen across the bottom of the page.
- Aesthetic Rejection: Many geographers argue that the extreme stretching makes the map unappealing and difficult to read intuitively.
- False Claims of Originality: Peters' aggressive marketing alienated the academic community by ignoring James Gall’s 19th-century foundation and overstating his own innovation.
Cartographers point out that no single flat map can preserve area, shape, distance, and direction all at once. Compromise projections—such as the Robinson or the Winkel Tripel—balance these distortions to provide a more visually pleasing overview of the globe.
Cultural Impact and Modern Relevance
Despite its technical flaws, the Gall-Peters map permanently changed how educators talk about geography. It demonstrated that maps are not neutral windows into reality; they are visual arguments crafted by human choices.
During the 1980s and 1990s, organizations like the United Nations and various humanitarian groups adopted equal-area maps to foster a more balanced global perspective. Schools began introducing multiple projections into classrooms, teaching students that shifting the map changes how we value regions. In a digital era dominated by interactive mapping tools like OpenStreetMap, understanding projection bias helps us interpret data layers without falling into visual traps.
Frequently Asked Questions
Is the Gall-Peters map upside down?
No, the Gall-Peters map is oriented with north at the top, just like standard Mercator maps. However, because it breaks traditional visual expectations of landmass sizes, people sometimes mistake it for an upside-down map. South-up maps exist, but Gall-Peters follows standard orientation while altering the projection math.
Why do digital mapping tools still use Mercator?
Web mapping tools like Google Maps use a variant of the Mercator projection (Web Mercator) because it preserves local angles and directions. This makes it effortless to render roads, zoom smoothly, and compute straight-line navigational paths on a digital screen without geometric distortion at small scales.
Does any map show the Earth without distortion?
No. Because the Earth is a three-dimensional ellipsoid, it is mathematically impossible to flatten it onto a two-dimensional surface without distorting at least one property: area, shape, distance, or direction. Every map is a compromise tailored to a specific purpose.
Who was Arno Peters trying to influence with his map?
Arno Peters wanted to push educational systems, international aid organizations, and the media away from Eurocentric perspectives. He believed that presenting the Global South in its true proportional size would encourage more equitable economic and political attitudes worldwide.