The United States contains 161 potentially active volcanoes, stretching from the Aleutian Arc in Alaska down through the Cascade Range in the Pacific Northwest, across Hawaii, and into parts of the American West. Tracking these systems requires looking past static textbook lists to dynamic spatial data. Federal agencies, research institutions, and open-source cartographers publish live tracking tools that monitor ground deformation, seismic rumblings, and gas emissions in real time.
Understanding how to read these interactive resources lets you evaluate regional safety threats, geological history, and active unrest without wading through dense academic papers. Here is a breakdown of where America's volcanic systems sit, how to use interactive tracking maps, and what the data actually tells us about geological risk.
Mapping the Risk: Where US Volcanoes Cluster
Volcanic activity in the United States concentrates along active tectonic plate boundaries and mantle hotspots. The country's total inventory splits across four primary geographic zones, each posing distinct hazards to nearby populations and infrastructure.
- Alaska: Accounting for over 80 percent of all active volcanic systems in the US, the Aleutian Arc and the mainland volcanic fields form a remote, highly active chain. Many sit directly beneath major international aviation corridors, making ash monitoring an economic and safety priority.
- The Pacific Northwest (Cascades): Washington, Oregon, and Northern California house iconic stratovolcanoes like Mount St. Helens, Mount Rainier, and Mount Hood. These peaks threaten densely populated valleys with fast-moving mudflows called lahars.
- Hawaii: Driven by an intraplate hotspot, the Hawaiian Islands feature shield volcanoes characterized by fluid basaltic lava flows. Kīlauea and Mauna Loa on the Big Island experience frequent eruptions, reshaping local landscapes rapidly.
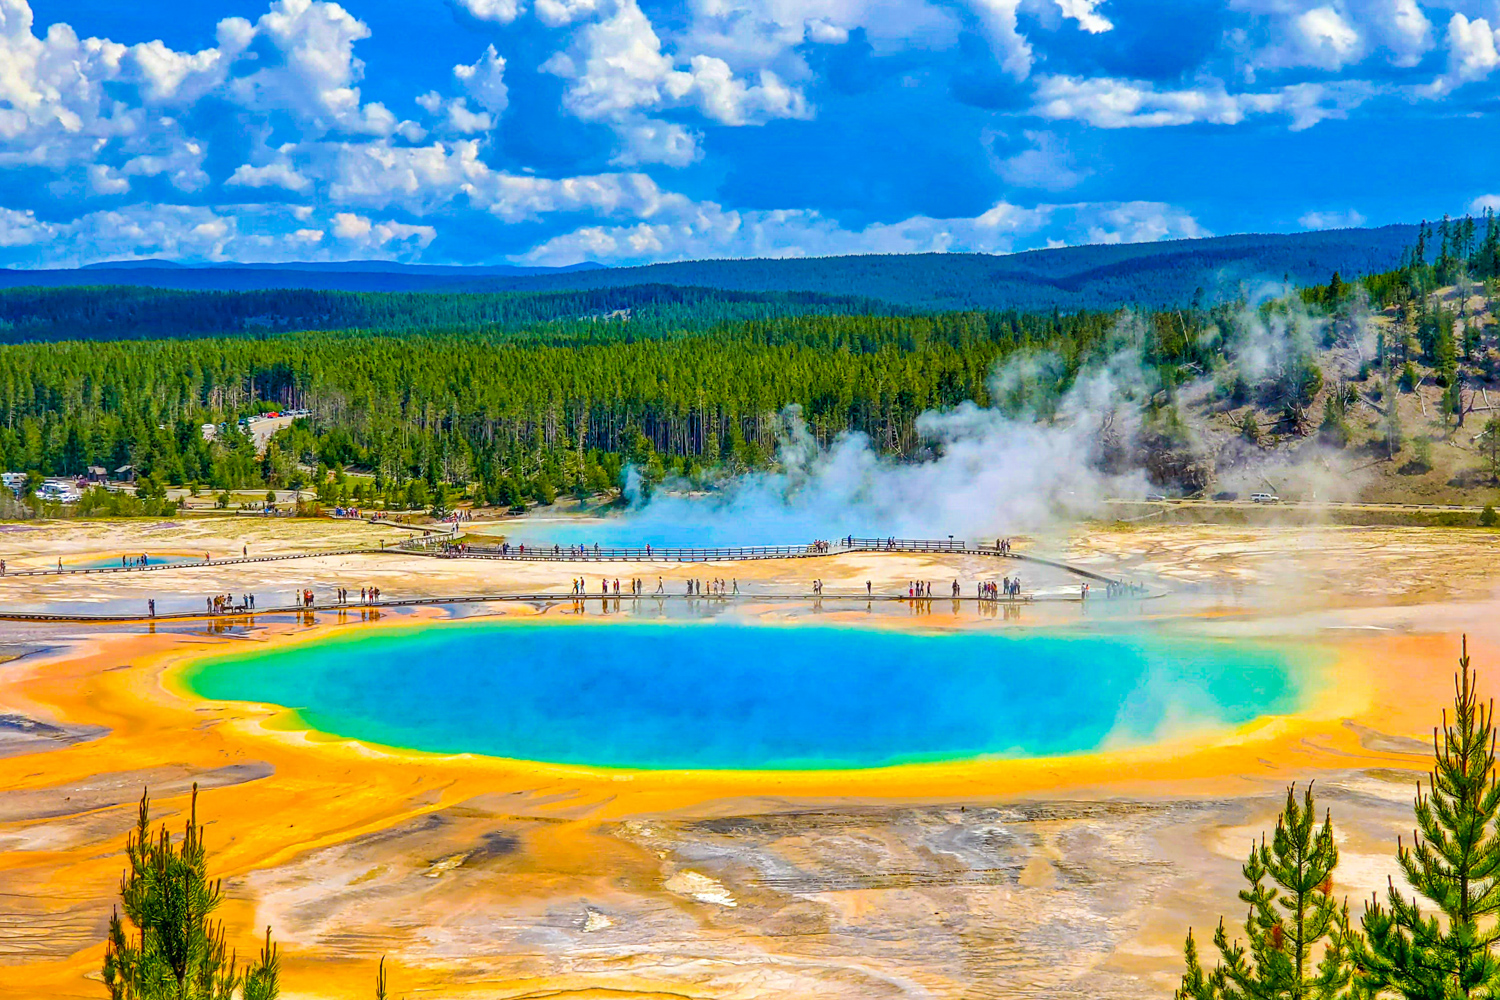
- The Intermountain West: This region includes Yellowstone in Wyoming and the Long Valley Caldera in California. These massive supervolcano systems erupt rarely, but their catastrophic potential keeps researchers watching deep magma chambers closely.
Essential Interactive Map Resources for US Volcanoes
Static maps printed in atlases go out of date the moment a vent opens or an earthquake swarm shifts a magma reservoir. Modern tracking relies on digital geographic information systems (GIS) and live-updating dashboards maintained by scientists and geospatial developers.
The USGS Volcano Hazards Program Map
The U.S. Geological Survey operates the official national monitoring network through the USGS Volcano Hazards Program. Their interactive mapping portals allow users to filter active monitoring networks by alert level, observatory region, and threat score.
- Threat Categorization: The USGS classifies systems from very low threat to very high threat based on local population exposure and eruption history.
- Live Observatories: Clicking on a specific volcano connects you directly to regional science centers—such as the Hawaiian Volcano Observatory or the Cascades Volcano Observatory—which publish daily updates, seismic spectrograms, and webcams.
ArcGIS Online and Open GIS Layers
For spatial analysis, open platforms host comprehensive vector layers. The ArcGIS USA Volcanoes Overview maps Holocene-era volcanic vents across the country. These layers let emergency planners overlay demographic data, highway networks, and watersheds onto volcanic hazard zones to model evacuation times before an emergency strikes.
Community-Built GIS Platforms
Independent mapping tools built on cloud platforms like Felt offer user-friendly interfaces for hobbyists and educators. These dashboards compile open-source government data into clean, browser-based maps that visualize distribution patterns without requiring specialized GIS software.
Decoding Volcanic Threats: How Scientists Measure Danger
Not all volcanoes present the same level of hazard. The USGS threat matrix evaluates 24 distinct factors, divided equally between the volcano's natural hazard attributes and the exposure of human society to those hazards.
- Volcanological Factors: This includes the frequency of eruptions over the past 5,000 to 20,000 years, the style of past eruptions (explosive ash-producers versus slow lava flows), and the composition of the magma.
- Societal Factors: This measures proximity to populated areas, air traffic density downwind, local economic infrastructure, and the history of aviation disruptions.
When you look at a national hazard map, volcanoes painted red face extreme scrutiny because an eruption would directly impact major population centers or critical transit lanes. Blue or green designations indicate lower immediate risk due to remote locations or long dormant periods, though they remain scientifically monitored.
Common Misconceptions About Volcanic Mapping
Navigating geological maps requires separating Hollywood tropes from actual science.
- Supervolcano Imminence: People often assume Yellowstone is overdue for a cataclysmic eruption on a fixed calendar schedule. Geologists emphasize that geological time doesn't work on clockwork intervals; monitoring data shows no indication of an impending super-eruption.
- Lava Flow Speed: While basaltic lava in Hawaii can move quickly down steep slopes, most volcanic hazards stem from secondary effects like ash fall, toxic gas emissions, and lahars rather than walls of slow-moving molten rock creeping into towns.
- Static Safety Zones: Hazard maps are not binary boundaries. A safe zone on a 10-year lava flow map can change entirely if a new vent opens on a different flank of the mountain.
Frequently Asked Questions
How many active volcanoes are in the United States?
The United States has 161 potentially active volcanoes that have erupted in the Holocene epoch, with the vast majority located in Alaska, followed by the Pacific Northwest and Hawaii.
Where can I check real-time volcanic activity in the US?
The USGS Volcano Hazards Program provides real-time monitoring data, including live webcams, earthquake activity logs, and aviation color-code alerts for every monitored region in the country.
What is the most dangerous volcano in the United States?
According to the USGS National Volcano Threat Assessment, Mount Rainier in Washington ranks as the highest-threat volcano due to its massive glacial ice caps, history of colossal mudflows, and close proximity to the Seattle-Tacoma metropolitan area.
Are all US volcanoes constantly monitored?
No. Monitoring intensity depends directly on threat ranking. High-threat and very high-threat volcanoes feature dense networks of seismometers, GPS ground-deformation sensors, and gas-sampling equipment, while remote low-threat volcanoes in rural Alaska rely primarily on satellite remote sensing.