Reading seaside tide tables is an essential skill for anyone spending time on the water, whether you're planning a fishing trip, launching a boat, or exploring coastal rocks. Tides aren't random; they follow predictable mathematical and gravitational cycles governed by the moon and the sun. By learning to interpret these charts, you can avoid getting stranded by rising water or missing prime fishing windows.
Understanding how to read a tide chart goes beyond looking at high and low numbers. Local geography, atmospheric pressure, and lunar phases all alter the baseline schedule. This guide breaks down the mechanics of coastal tides, explains how to read official tables, and highlights common mistakes that catch beachgoers off guard.
The Mechanics of Ocean Tides
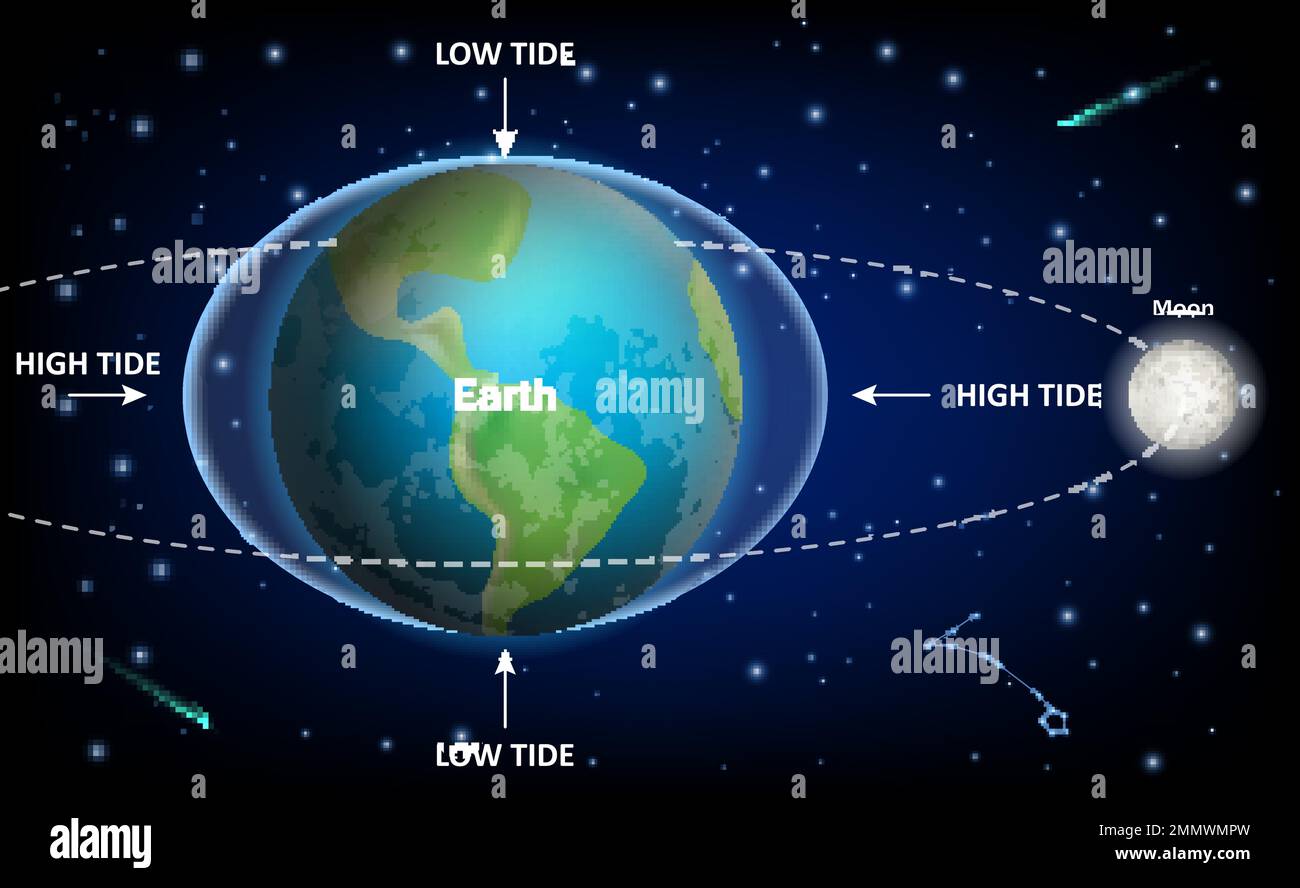
Ocean tides are driven primarily by the gravitational pull of the moon and, to a lesser extent, the sun. As the Earth rotates, water bulges outward on the side facing the moon and on the exact opposite side of the globe.
Gravitational Pull and Earth Rotation
As our planet spins through these gravitational bulges, coastal locations experience alternating cycles of water rise and fall. Because the moon orbits the Earth in the same direction our planet rotates, it takes roughly twenty-four hours and fifty minutes for a specific coastline to realign with the same tidal bulge. This extra fifty minutes explains why high and low tides shift roughly an hour later each day.
Spring and Neap Tides
Not all tides are equal. Twice a month, during the new moon and the full moon, the sun, moon, and Earth align. This combination creates spring tides, which feature the highest high tides and lowest low tides of the month. Conversely, when the moon is at a first or third quarter phase, the gravitational forces pull at right angles to each other, creating neap tides with much smaller differences between high and low water levels.
How to Read a Tide Table
A standard daily tide table provides a structured schedule of water level changes for a specific geographic reference station. Official predictions in the United States are published by the National Oceanic and Atmospheric Administration (NOAA Tides & Currents), while international agencies provide equivalent regional data.
Key Columns in a Tide Table
When you open a tide chart for your local beach or harbor, you will typically see four main data points for each cycle:
- Time: The predicted hour and minute when the water reaches its absolute peak (high tide) or trough (low tide), usually listed in 24-hour format.
- Height: The predicted water level measured in feet or meters relative to a vertical datum, such as Mean Lower Low Water (MLLW).
- Type: A clear label indicating whether the event is high water or low water.
- Tidal Current: Advanced tables also show the speed and direction of the water moving between stages.
Factoring in Local Geography
A tide table for a major harbor won't give you exact numbers for a hidden cove five miles down the coast. Bays, narrow river mouths, and shallow estuaries cause frictional drag and resonance, which can delay the arrival of the tide by hours or amplify the height significantly. Always look for subordinate stations listed in your tide book that apply corrections to the primary reference station.
Practical Applications for Coastal Planning
Knowing the water schedule transforms how you approach recreational and professional coastal activities.
Fishing and Marine Activity
Game fish respond heavily to water movement. An incoming or flood tide pushes baitfish into shallow estuaries and shoreline structures, triggering active feeding. Experienced anglers use tide tables to target these active windows, arriving an hour before water begins rushing into a channel.
Boating and Navigation
Navigating shallow inlets requires strict adherence to vertical clearances and channel depths. If your vessel draws three feet of water, a low tide reading of 0.5 feet above datum means you risk running aground unless you wait for the rising tide to add necessary clearance.
Beachcombing and Safety
Low tides reveal intertidal zones, tide pools, and hidden rock formations. However, a falling tide can quickly become a rising hazard. Coastal shelves and narrow coves can become entirely cut off by water within minutes, trapping unsuspecting hikers against sheer cliffs.
Common Mistakes When Using Tide Charts
Even seasoned beach visitors make errors when interpreting raw data. Avoid these frequent pitfalls:
- Ignoring Daylight Saving Time: Many printed charts use Greenwich Mean Time (GMT) or local standard time. Failing to adjust for daylight saving time shifts your timing by an entire hour.
- Confusing Height with Depth: The numbers on a tide table represent height relative to a chart datum, not the actual total depth of the water column. You must add the chart datum depth to find the true depth.
- Neglecting Weather Impacts: High barometric pressure and strong offshore winds push water levels down, while coastal storms and low pressure create storm surges that push water much higher than predicted tables suggest.
Frequently Asked Questions
How many high and low tides happen each day?
Most coastal locations experience a semidiurnal tide pattern, meaning there are two high tides and two low tides every lunar day, roughly every 24 hours and 50 minutes. Some regions experience only one high and one low tide daily, known as a diurnal tide.
What is a minus tide?
A minus tide occurs when the predicted low water level drops below the standard zero reference point (MLLW) established for that station. These extreme low tides expose rarely seen marine life and expansive sandbars, making them popular for beachcombing and clamming.
Can weather change the tide schedule?
While weather cannot alter the gravitational schedule of high and low water times significantly, it directly impacts water height. Severe winds and low atmospheric pressure can cause water levels to exceed table predictions by several feet.
Where can I find reliable tide data?
Official government meteorological sites and specialized marine weather apps provide real-time updates and accurate predictions. Always cross-reference mobile apps with official regional data before embarking on remote coastal excursions.