Mastering Rhode Island's coastal waters requires tracking local tide cycles because sea levels across Narragansett Bay and Block Island Sound swing by up to five feet twice daily. Misjudging these movements strands vessels on sandbars, cuts off coastal walking paths, and sweeps beachgoers into dangerous rip currents.
Reading a Rhode Island tide chart means looking past basic high and low times to calculate water volume, current velocity, and local geographic quirks. Whether you're navigating the rocky shores of Newport, fishing the breachways in Westerly, or launching a kayak in Narragansett, understanding these marine rhythms prevents costly maritime mistakes.
Anatomy of a Rhode Island Tide Chart
A standard tide chart lists daily high and low water marks, paired with predicted heights measured against a fixed baseline. In coastal United States waters, these heights reference Mean Lower Low Water, abbreviated as MLLW.
- High Tide Markers: Marked with an H, this indicates the peak water level for that cycle. Positive numbers show how far the water rises above the MLLW baseline.
- Low Tide Markers: Marked with an L, this shows the trough of the wave cycle. Negative numbers indicate extreme low water dropping below the average baseline.
- Tidal Range: This is the vertical distance between consecutive high and low marks. A large range signals massive water volume moving quickly through narrow channels.
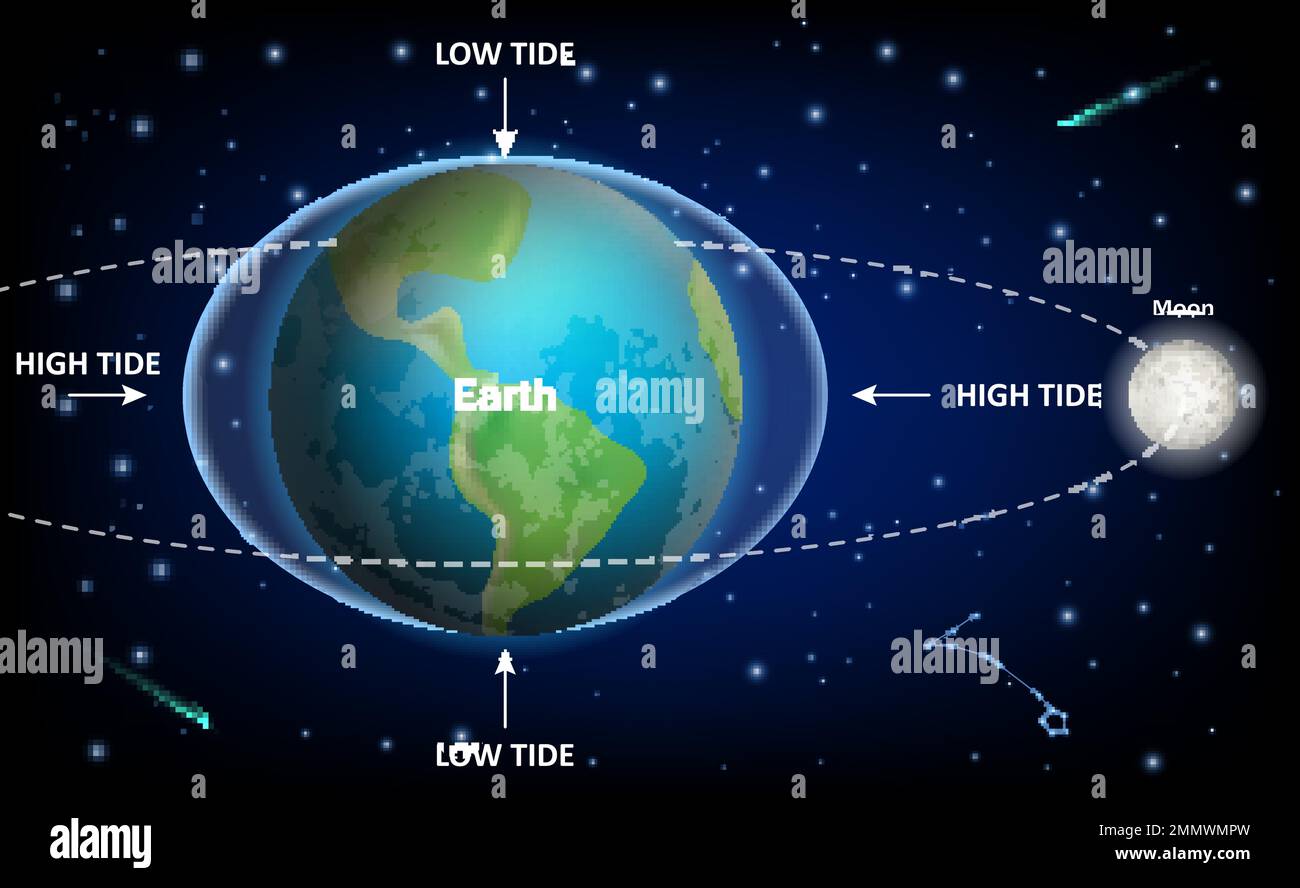
Rhode Island features a semidiurnal tide pattern, meaning most coastal zones experience two high tides and two low tides roughly every 24 hours and 50 minutes. Because this cycle shifts nearly an hour later each day, you can't rely on the same times week after week.
Geographic Variations Across Rhode Island Waters
You cannot use a single tide prediction for the entire Ocean State. Local topography drastically alters when and how water moves.
Open Ocean (Block Island / Watch Hill)
   vs.
Protected Estuaries (Providence River / Upper Narragansett Bay)
The outer coast experiences ocean swells directly, while upper Narragansett Bay acts as a funnel. For example, high tide in Providence occurs over an hour later than high tide at the mouth of Narragansett Bay because the tidal wave takes time to travel up the estuary.
Narrow breachways along the southern coast, such as Ninigret Pond or Quonochontaug Pond, create violent water velocity shifts. As the tide rushes through these narrow cuts, currents can easily overpower swimmers and paddlers, even on calm days. Always check the tide station closest to your exact recreation spot rather than relying on a generalized statewide summary.
Safety Risks Tied to Coastal Water Movements
Ignoring tidal schedules creates serious hazards along rocky shores and salt ponds.
Getting Cut Off by Rising Tides
Pointe locations like Beavertail State Park or the rocky ledges around Narragansett feature shelves that sit above water at low tide but submerge completely during incoming surges. Walkers who explore these areas risk getting trapped against sheer rock faces as icy water blocks their return path.
Swift Tidal Currents in Breachways
As bays and salt ponds drain during an ebb tide, millions of gallons of water rush through narrow coastal inlets. Swimming or kayaking against an outgoing tide in these channels is exhausting and often impossible. Many water rescues in South County stem from paddlers underestimating outgoing current speeds.
Hidden Obstacles and Vessel Grounding
Boaters navigating shallow estuaries like the Pawcatuck River or Greenwich Bay can run aground within minutes if they ignore the chart datum. Hitting a sandbar at high speed damages hulls and strands passengers miles from safe harbor.
How to Plan Safer Coastal Adventures
Integrating tide data into your outdoor planning routine takes just a few minutes and eliminates guesswork.
- Identify your exact coordinates: Look up the specific NOAA tide station nearest your launch or walking site using NOAA Tides & Currents.
- Calculate the window: Plan shoreline walks and intertidal explorations during a falling tide so the water moves away from you rather than trapping you against cliffs.
- Account for weather anomalies: Strong offshore winds or low-pressure storm systems push actual water levels a foot or higher above predicted chart numbers.
- Watch the slack water: Remember that peak current velocity often happens halfway between high and low tide, while slack water occurs near the turn of the tide.
Frequently Asked Questions
What is a minus tide and why does it matter?
A minus tide happens when the low water level drops below the established MLLW baseline. These extreme lows expose reefs, shallow rocks, and intertidal flats that normally stay submerged, making them useful for clamming but hazardous for boating.
Why do tide times change every day?
Tides are driven primarily by the gravitational pull of the moon. Because the moon orbits Earth while Earth rotates, a full tidal cycle takes 24 hours and 50 minutes, causing daily high and low marks to shift roughly 50 minutes later each day.
Are wind and weather able to override tide charts?
Yes. Sustained high winds, coastal storms, and atmospheric pressure changes cause storm surges that override normal lunar predictions, sometimes raising water levels well beyond chart maximums.
How far in advance are tide predictions accurate?
Official agencies like the National Ocean Service calculate astronomical tide tables years in advance with high mathematical accuracy, though severe weather events can alter day-of reality.