Mastering Rhode Island tide charts is essential for anyone navigating Narragansett Bay, fishing the rocky outcrops of Point Judith, or planning a trip to Block Island. Because Rhode Island features complex coastal geography with narrow passages, shallow bays, and open ocean exposures, water levels shift dramatically throughout the day. Misjudging these cycles can leave your boat stranded on a sandbar, wash tackle away, or create hazardous rip currents along the shore.
Official tidal forecasting relies on data collected by agencies like the National Oceanic and Atmospheric Administration, which models water movements based on gravitational pulls and local basin geometry. Whether you're checking daily tables on platforms like US Harbors or tracking extreme swings during seasonal king tides via MyCoast Rhode Island, understanding how to read and apply these numbers keeps you safe on the water.
Understanding Rhode Island Tidal Patterns
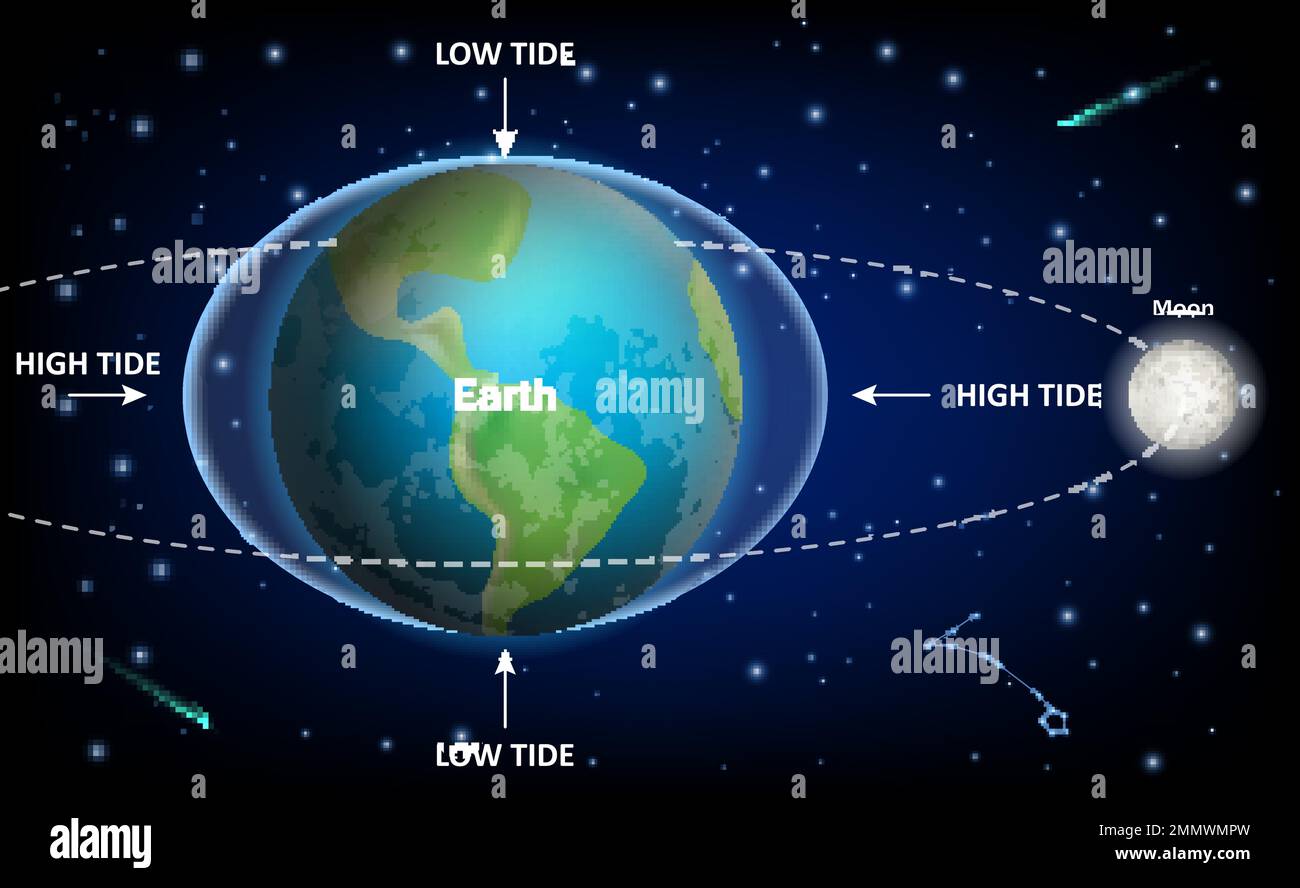
Rhode Island experiences semi-diurnal tides, meaning there are generally two high tides and two low tides every lunar day, roughly every 24 hours and 50 minutes. However, the state's geography creates distinct variations between open ocean shores and inner protected bays.
Tidal range—the vertical distance between high and low water—changes significantly depending on where you drop anchor: More reporting by Bloomberg highlights related views on this issue.
- Outer Coast and Block Island: Open ocean areas like Block Island and Watch Hill experience moderate tidal ranges, usually hovering around 3 feet.
- Narragansett Bay: As the tide funnels north into Narragansett Bay and toward Providence, the restricted geography can amplify water movement and shift timing.
You must never assume that high tide occurs at the exact same hour across the entire state. A flood tide entering Point Judith takes time to propagate up through the bay, creating localized time lags that catch inexperienced boaters off guard.
Why Tide Charts Matter for Safety and Success
Ignoring the rhythm of the ocean introduces unnecessary risks. Knowing the exact state of the tide affects multiple aspects of coastal recreation and commercial work:
- Vessel Grounding Prevention: Navigating shallow channels, salt ponds, or rocky coves requires knowing your boat's draft relative to Mean Lower Low Water (MLLW). Dropping into a thin channel at falling tide can trap you for hours.
- Current Velocity Management: Narrow bottlenecks like the Sakonnet River or bridge abutments generate swift tidal currents. Trying to motor against a peak ebb current burns excess fuel and strains engines.
- Shoreline Safety: Anglers fishing rocky ledges around Narragansett or Newport face extreme danger from sneaker waves or rising water that cuts off escape routes during a rapidly flooding tide.
How to Read and Interpret Tide Tables
A standard Rhode Island tide table lists high and low water events with specific timestamps and predicted heights.
Sample Daily Tide Data Format:
High Tide: 02:31 AM | 3.0 ft
Low Tide:  09:16 AM | 0.3 ft
High Tide: 03:06 PM | 3.0 ft
Low Tide:  09:54 PM | 0.2 ft
Heights are typically measured in feet relative to MLLW. Negative numbers on a tide chart indicate extreme low water conditions, often happening during specific lunar phases or low-pressure weather systems. When planning a coastal activity, look at both the height and the time interval. A rapid drop in water level over a short window signals a fast-moving current.
Common Mistakes to Avoid
Even seasoned locals occasionally run into trouble by misapplying tidal data. Keep these pitfalls in mind:
- Using the wrong reference station: Checking Newport tables for a shallow salt pond or a narrow river inlet introduces severe errors due to geographical lag. Always pick the nearest specific station.
- Ignoring weather and wind: Meteorological forces alter predicted tides significantly. Sustained high winds from the south can push water up Narragansett Bay, causing coastal flooding even when baseline tidal predictions look normal.
- Confusing standard time and daylight saving time: Always verify whether your tide chart matches local clock time or coordinated universal time, especially during seasonal transitions.
Frequently Asked Questions
What is the difference between a predicted tide and an observed tide?
Predicted tides are mathematical forecasts based on historical astronomical data and harmonic constituents. Observed tides are real-time measurements recorded by physical sensors and water gauges, which account for current weather conditions, wind, and atmospheric pressure.
Why do tide times change every day?
Tides are primarily driven by the gravitational pull of the moon and the sun relative to Earth. Because the moon orbits Earth in the same direction our planet rotates, it takes our planet an extra 50 minutes each day to align with the moon again, pushing daily tide cycles forward.
How do I find tide data for smaller coves or rivers in Rhode Island?
If your exact location isn't listed on primary tables, look for a nearby secondary station and apply the published time offsets (plus or minus minutes) provided in comprehensive tide reference manuals or NOAA supplementary tables.
What are king tides and why do they matter in Rhode Island?
King tides are extreme, naturally occurring high tides that happen when gravitational alignments peak during new or full moons close to the equinox. In Rhode Island, they cause minor coastal flooding on low-lying roads and help researchers monitor sea-level trends.