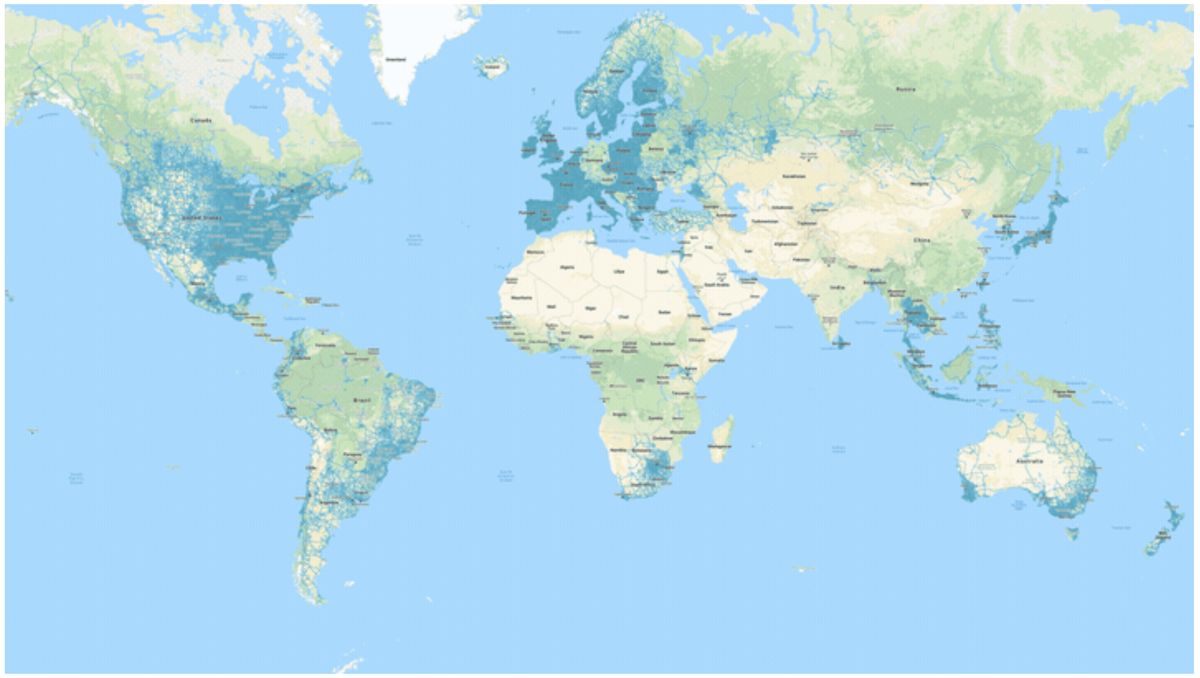
Geographic postal data transforms flat spreadsheet rows into actionable spatial territory. When you map with zip codes, you aren't just plotting numbers on a screen; you're uncovering hidden regional demand, customer clusters, and logistical bottlenecks that traditional tabular reports conceal. Whether you're planning delivery routes or analyzing retail catchment areas, understanding spatial postal metrics gives your operations a clear competitive edge.
The core challenge isn't acquiring boundary files—it's knowing how to clean messy customer databases, select the right mapping software, and interpret regional densities without falling for scale distortion. Let's break down the exact strategies, tools, and technical workflows required to turn raw postal files into high-performing maps.
Understanding Postal Geometries and Data Structures
Before building a spatial visualization, you need to understand what a postal code actually represents in geographic information systems. Unlike clean administrative boundaries like counties or municipalities, postal codes are created by postal services like the USPS primarily for efficient mail sorting and delivery routing.
This means postal zones change frequently, overlap, and can even consist of single high-volume buildings rather than contiguous regions.
- Point vs. Polygon Data: Postal datasets typically come as centroid points (latitude and longitude coordinates of a code's center) or polygon boundaries (area shapes). Centroids work well for proximity analysis, while polygons are essential for territory creation and demographic overlays.
- Granularity Challenges: Standard postal zones vary wildly in geographic size. A dense urban code might cover a few city blocks, while a rural code spans hundreds of square miles. If you don't account for population density, visual maps will heavily skew your perception toward large rural areas.
- Data Hygiene: Customer databases often contain typos, outdated entries, or nine-digit ZIP+4 codes that standard mapping tools fail to parse unless properly normalized to five-digit formats.
Choosing the Right Mapping Tools
Selecting the correct software depends entirely on your dataset size, budget, and visualization needs. You don't need expensive enterprise geographic information systems for basic territory planning, but spreadsheet plugins won't cut it for complex spatial modeling.
- Spreadsheet Add-ins: Tools like Excel's built-in mapping features or Google Sheets extensions work well for quick point plots of fewer than a few thousand rows. They're ideal for basic regional sales summaries.
- Dedicated Business Mapping Platforms: Software such as MapBusinessOnline or Maptitude allows you to build custom sales territories, draw drive-time polygons, and import demographic overlays directly onto postal boundaries.
- Open-Source and Code Libraries: For advanced developers and data scientists, Python libraries like GeoPandas and Folium, or open-source desktop software like QGIS, offer unmatched flexibility and zero licensing costs for rendering custom shapefiles.
Step-by-Step Workflow for Building Your First Postal Map
Creating an accurate map requires a structured pipeline from raw data export to final visual styling. Skipping data preparation steps guarantees rendering errors and misallocated territories.
- Clean and Format Your Dataset: Export your customer or asset data into a CSV format. Ensure the postal column is formatted as text so leading zeros in eastern regions don't get accidentally dropped by spreadsheet software.
- Geocode or Join Boundaries: Import your CSV into your chosen mapping platform. If your tool supports native postal boundary joins, match your data column directly to the software's built-in postal polygon layer. Otherwise, use latitude and longitude coordinates.
- Select a Normalization Metric: Never map raw counts alone. If you map total sales by zip code, you'll just highlight your largest population centers. Instead, calculate metrics per capita or percentage of market potential to reveal true performance anomalies.
- Choose Classification Breaks: Apply natural breaks or quantile classification methods to your color ramp. Avoid equal intervals if your data contains extreme outliers, as this hides variations in high-density urban areas.
- Export and Share: Test your map across different screen sizes and export high-resolution vector formats if you're embedding them in executive slide decks or printed reports.
Common Pitfalls in Spatial Postal Analysis
Even experienced analysts run into spatial traps when working with postal data. Recognizing these mistakes saves time and prevents costly operational miscalculations.
- Ignoring Modifiable Areal Unit Problems: Data aggregated by postal boundaries can change dramatically if you redraw the boundaries. Don't treat a zip code as a homogeneous demographic monolith.
- Failing to Update Boundary Files: Postal authorities modify, split, and retire codes regularly. Using stale boundary files from three years ago means a portion of your current customer base won't plot correctly.
- Overloading Visual Layers: Putting too many data layers on a single map creates cognitive overload. Keep your base map clean and use interactive tooltips for secondary variables rather than cluttering the visual field.
Frequently Asked Questions
Why do some zip codes appear as single points on a map?
Many mapping platforms default to representing postal codes using their centroid coordinates rather than full polygon shapes. If you need area coverage, you must explicitly import or select polygon boundary files from official cartographic sources like the US Census Bureau.
How often should I update my postal boundary datasets?
You should refresh your boundary files at least annually. Postal agencies introduce new delivery routes and adjust boundaries continuously to match urban growth and shifting populations.
Can I map international postal codes alongside domestic ones?
Yes, but you need software that supports multi-country boundary layers and handles different international postal formats, such as alphanumeric postal codes used in the United Kingdom or Canada.
What is the best way to handle missing or invalid postal codes in my dataset?
Filter out invalid entries before importing your data into mapping software. Set up a validation script or spreadsheet rule to flag codes that don't match standard length or format requirements so you can manually verify them against customer shipping addresses.



