Tracking weather patterns in the heart of the Sonoran Desert requires understanding more than just a daily temperature check. If you live in or are visiting this Maricopa County community, knowing how to interpret local radar, seasonal shifts, and long-term climate trajectories will help you plan outdoor work, travel, and home cooling strategies effectively.
Gilbert features a classic hot desert climate, characterized by intense summers and mild, clear winters. Annual rainfall stays low, typically averaging around nine inches per year, meaning that local atmospheric tracking focuses heavily on wind patterns, high-pressure ridges, and monsoon moisture surges rather than constant rain checks.
Reading Gilbert Radar and Live Atmospheric Tracking
When you pull up live radar for the area, you're looking at data processed from regional Doppler stations covering the Phoenix metropolitan network. Because precipitation is sparse, local radar often displays dry-line shifts, blowing dust during high-wind events, or distant storm cells rolling off the Superstition Mountains rather than steady rain showers.
- Clear-Air Mode: Most of the year, radar operates in clear-air mode to detect particulate movement, smoke from regional wildfires, and minor wind shifts.
- Precipitation Echoes: During winter storms or the summer monsoon, echoes display intensity gradients. Bright greens and yellows indicate moderate rain, while embedded reds point to brief, heavy downpours that can cause sudden street flooding in low-lying intersections.
- Dust Storm (Haboob) Tracking: Specialized radar layers and satellite loops help track wall-of-dust events moving across the Valley from the south and west, giving motorists critical minutes to exit roadways.
For official real-time updates and active warnings, consult the National Weather Service Phoenix, which monitors localized microclimates across the East Valley.
Seasonal Climate Breakdown
The local environment shifts through distinct thermal phases that dictate daily life. Understanding these phases helps residents manage utility costs and outdoor exposure.
Summer Heat and Monsoon Dynamics
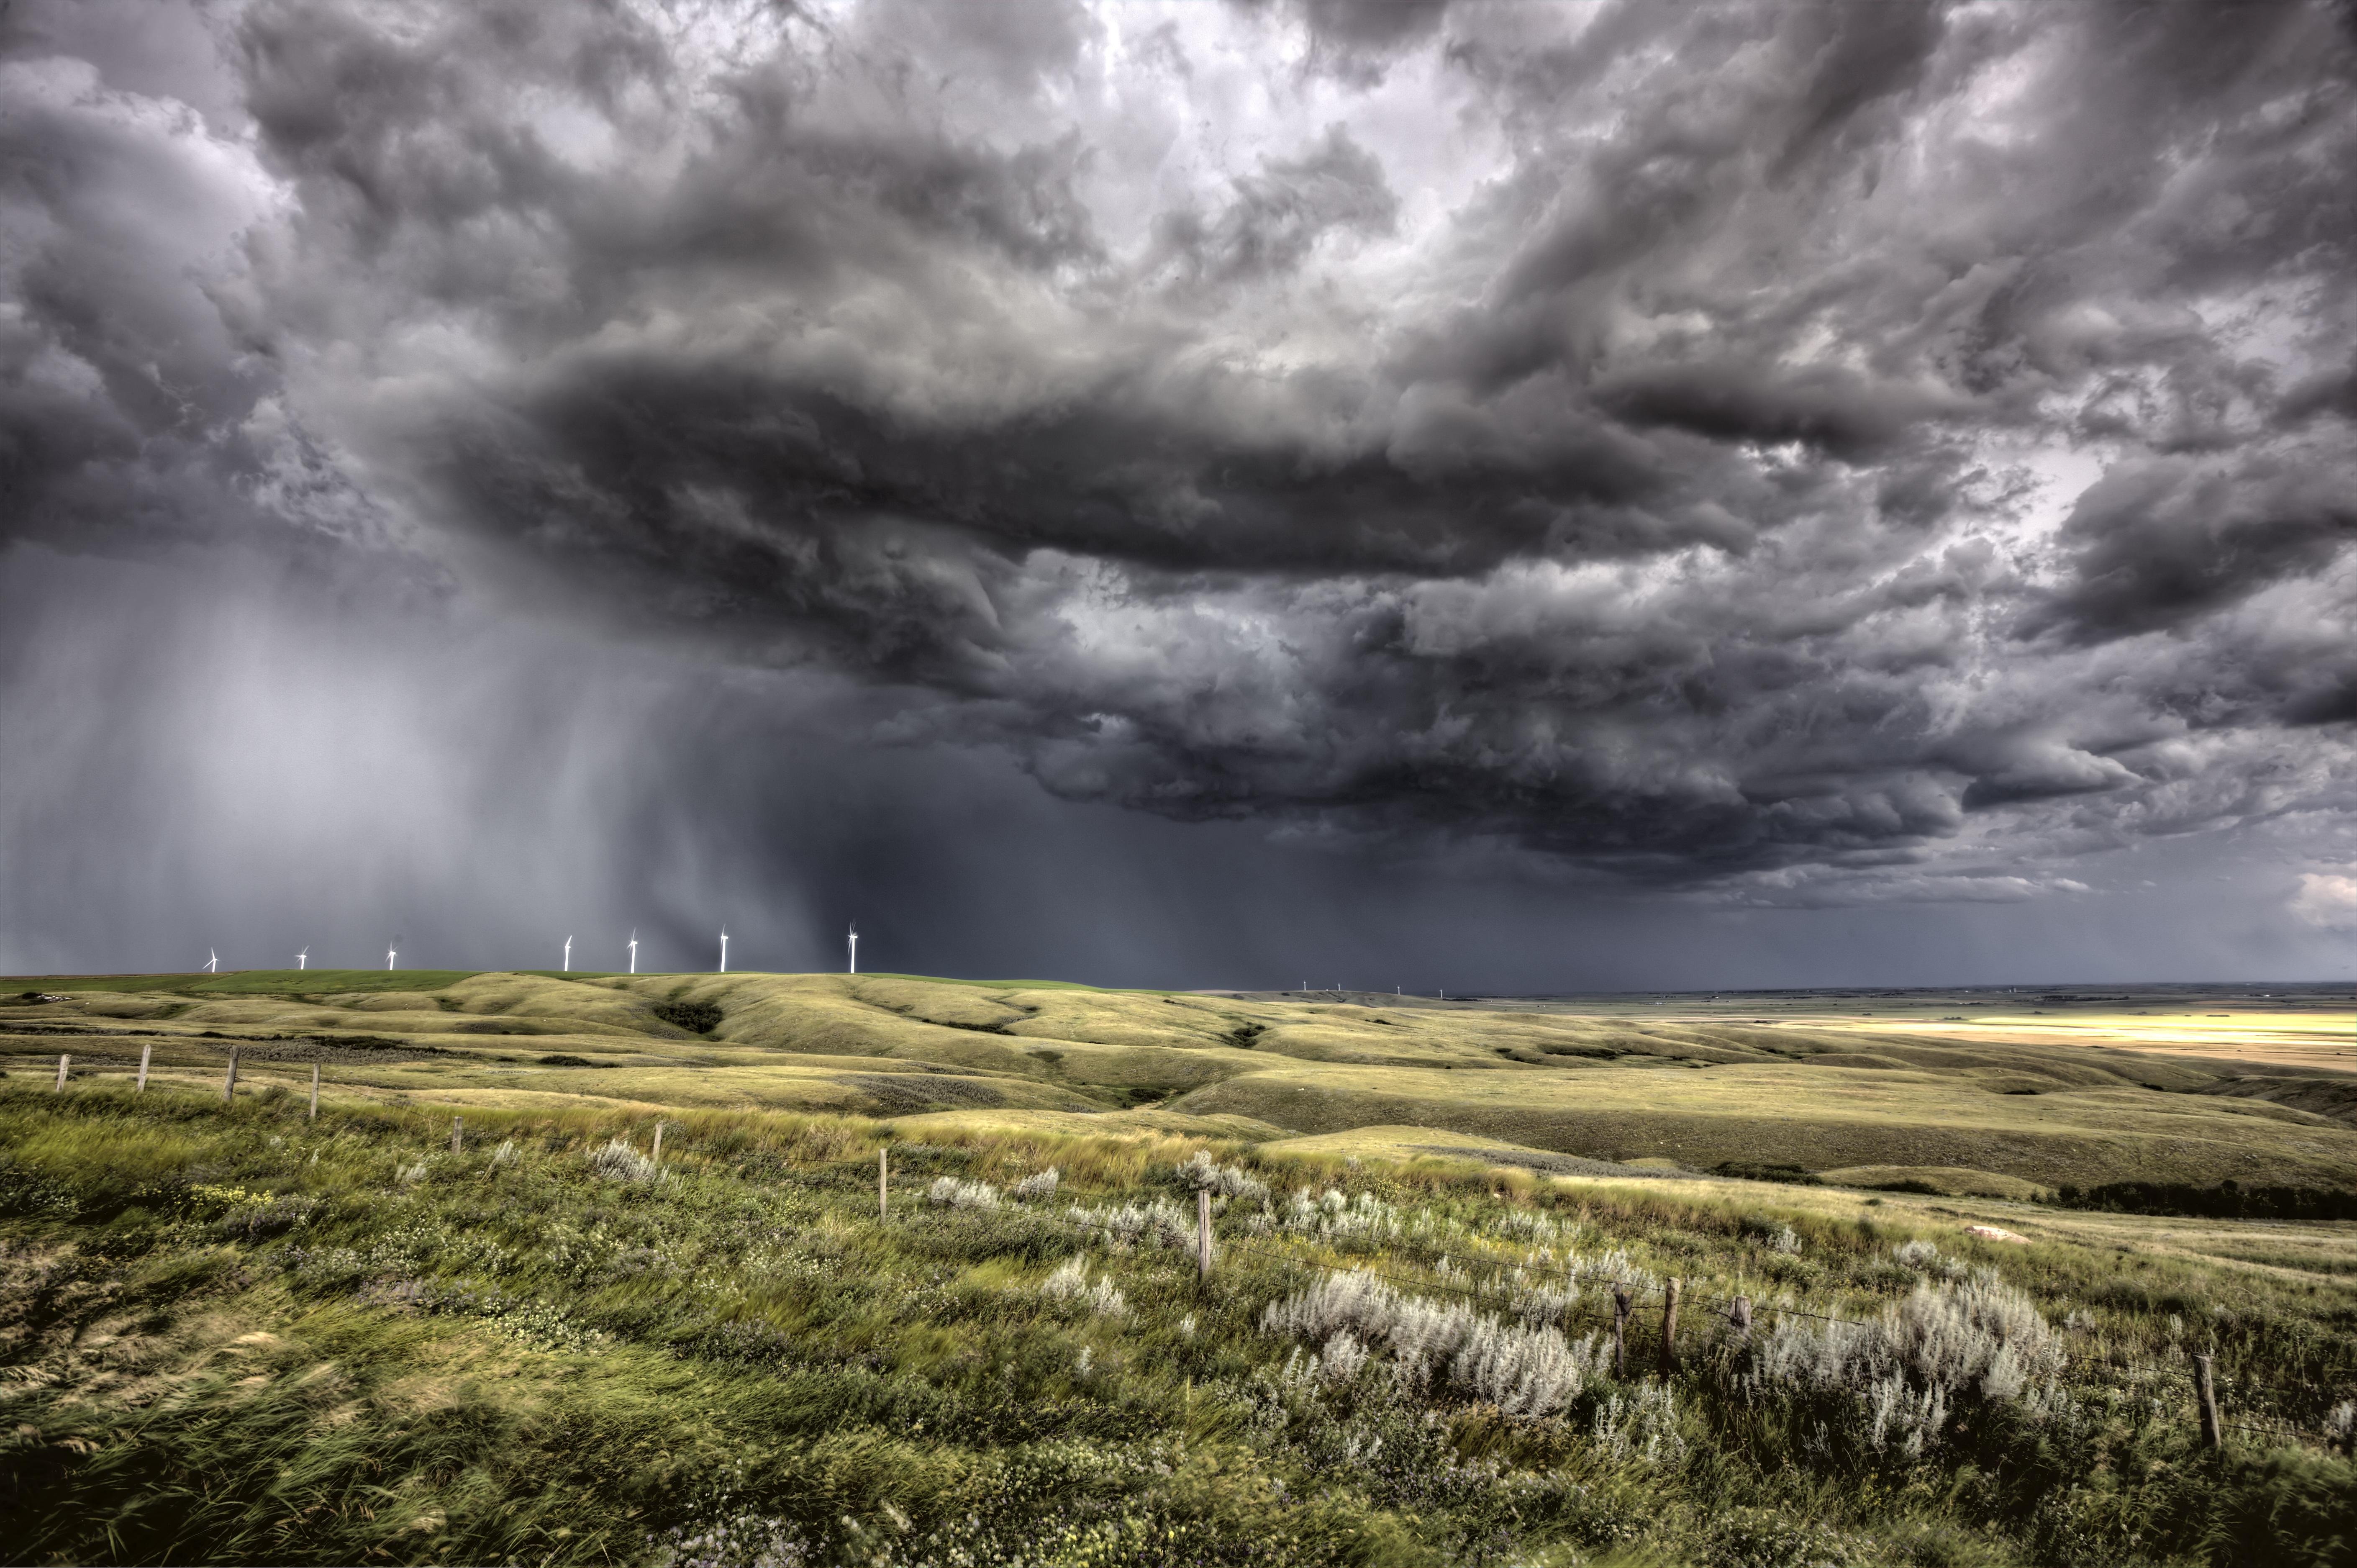
The hot season stretches from late May through mid-September, where daily highs regularly exceed 97 degrees Fahrenheit, often peaking above 105 degrees in July. Humidity remains relatively low for most of the year, but July and August bring the North American Monsoon. This weather pattern pulls moisture up from the Gulf of California and the Gulf of Mexico, introducing humid conditions, towering cumulonimbus clouds, sudden microbursts, and dramatic lightning storms.
Winters and Transitional Months
From November to February, daytime highs hover in the comfortable 65 to 75-degree range, while overnight lows can dip into the low 40s. Winter is the primary window for frontal systems moving across the American Southwest, bringing gentle, intermittent rainfall that accounts for a significant portion of the annual precipitation total. Spring and autumn serve as brief, pleasant transitional windows characterized by clear skies and minimal wind.
Long-Term Climate Trends in the East Valley
Meteorological records for Maricopa County indicate clear shifts in baseline temperatures over recent decades. Urban expansion and the expansion of paved surfaces have intensified the urban heat island effect, particularly overnight.
- Elevated Overnight Lows: Summer nighttime temperatures don't cool down as efficiently as they did decades ago, with lows frequently staying above 85 degrees during peak heat waves.
- Extended Heat Waves: Prolonged blocking high-pressure systems, colloquially known as heat domes, are lasting longer into September, stretching the traditional cooling season.
- Precipitation Variability: While annual averages remain near nine inches, rainfall events are becoming more polarized—featuring long dry spells punctuated by intense, high-volume downpours that strain local drainage systems.
For broad climate context and historical baselines, you can review regional reporting provided by the National Centers for Environmental Information.
Managing Extreme Weather Events
Living in the desert requires practical preparedness for rapid environmental shifts. Whether it's an excessive heat warning or a flash flood advisory, small proactive measures protect both people and property.
- Monitor Air Quality: Dust, particulate matter, and ozone spikes frequently trigger local air quality advisories. Check the index before planning strenuous outdoor exercise.
- Prepare for Power Surges: Summer monsoon thunderstorms pack high winds that can knock down power lines. Keep emergency cooling supplies and backup phone chargers accessible.
- Secure Outdoor Assets: Patio furniture, umbrellas, and shade sails must be tied down securely before summer storm cells arrive with straight-line winds exceeding 50 miles per hour.
Frequently Asked Questions
Does it ever snow in Gilbert?
Accumulating snow is virtually unheard of due to the low elevation and warm winter baseline temperatures. Frozen precipitation has been recorded in rare historical instances across the broader Phoenix valley, but it melts on contact.
When is the rainiest month of the year?
Winter frontal systems typically make January or February the wettest months on average, though the summer monsoon in August can occasionally deliver comparable monthly totals through brief, intense storms.
How does the urban heat island impact local forecasts?
Standard forecasts often account for concrete and asphalt heat retention, meaning suburban neighborhoods away from direct weather stations can experience subtle microclimate temperature variations of two to four degrees.
Where can I check live wind and dust advisories?
Local transportation departments maintain real-time sensor networks alongside federal meteorological feeds to track visibility on major regional corridors like US-60 and Loop 202.



