When the U.S. Census Bureau released the official tally from the 2020 decennial count, the headline figure captured immediate attention: the resident population of the United States stood at 331,449,281. Crossing the 331-million threshold prompted widespread national discussion about shifting economic power, geographic migration, and changing social structures. Raw headcounts provide a starting point, but the real story lies in what these federal numbers tell us about who lives in the country, how they move, and where society is heading.
Demographic data serves as a practical roadmap for public policy, corporate strategy, and resource allocation. Looking past the headline figure reveals crucial insights into aging trends, racial and ethnic diversity, housing density, and geographic shifts. Understanding these baseline numbers helps economists, urban planners, and everyday citizens grasp the mechanics of modern American society.
The Foundation of Growth: Growth Rates and Historical Context
Population growth in the United States has experienced distinct phases throughout its history. While hitting over 331 million residents marked a major milestone, the pace of that growth has actually slowed down significantly compared to previous decades.
Slowing Growth Rates
The period between 2010 and 2020 recorded one of the lowest population growth rates in American history, trailing only the decade following the Great Depression. Several factors drove this slowdown:
- Falling fertility rates across nearly all age groups.
- Decreasing net international migration due to various policy changes and global disruptions.
- An aging domestic population leading to a higher baseline mortality rate.
Natural Increase Versus Migration
Historically, American population growth relied heavily on a balance of "natural increase"—births minus deaths—and net migration. As birth rates dropped closer to or below replacement levels in many states, migration patterns became the primary driver of regional population changes. Understanding this shift helps explain why certain regions expanded rapidly while others stagnated or experienced population declines.
Geographic Redistribution: The Shift to the Sun Belt
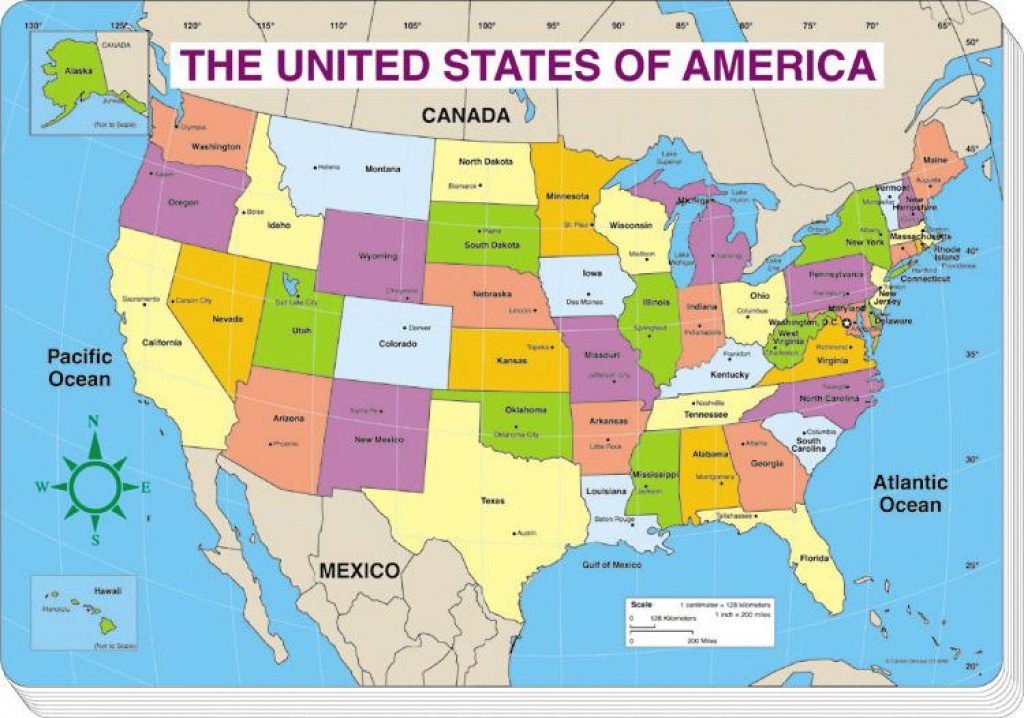
People aren't distributed evenly across the 50 states. The 331 million figure reflects a massive, ongoing geographic realignment. Americans have been moving away from northern and midwestern industrial centers toward southern and western states, commonly referred to as the Sun Belt.
State-Level Winners and Losers
This internal migration directly impacts political representation and federal funding. Following the 2020 census count, several states gained congressional seats—notably Texas, Florida, and North Carolina—while states like New York, California, and Illinois lost representation due to slower relative growth or outright population drops.
Urbanization and Suburban Sprawl
Growth isn't just happening at the state level; it's transforming local communities. Major metropolitan areas continue to absorb millions of new residents, though the nature of urban centers is changing. High housing costs in core downtown districts have fueled massive expansions in outer suburbs and secondary satellite cities. Analyzing housing unit statistics from sources like the U.S. Census Bureau Profile shows how residential construction has scrambled to keep pace with these shifting settlement patterns.
Diversity and Age Structures
A population of over 331 million people is remarkably diverse, spanning a broad spectrum of ages, racial backgrounds, and cultural heritages. The statistics show a nation caught between two major demographic transformations: increasing racial diversity and a rapidly aging workforce.
The Graying of America
As the massive Baby Boomer generation ages into retirement, the median age in the United States climbs steadily. This demographic shift places unique pressures on healthcare systems, Social Security, and eldercare infrastructure. Communities with high concentrations of retirees face very different economic realities compared to university towns or booming tech hubs with younger, family-age populations.
Multiracial and Multiethnic Expansion
Census data highlights an expanding tapestry of racial and ethnic identities. The Hispanic or Latino population alone accounts for tens of millions of residents, and the multiracial population category has grown significantly faster than single-race categories over recent decades. This diversification reshapes consumer markets, educational curricula, and political coalitions across the country.
Economic Realities Behind the Numbers
Population figures gain true context when paired with economic indicators. A country of 331 million people generates a massive gross domestic product, but distribution metrics tell a more nuanced story about individual well-being, educational attainment, and household stability.
Income and Education Benchmarks
Federal surveys, such as the American Community Survey managed by the U.S. Census Bureau, track vital socioeconomic markers alongside raw headcounts. Key data points include:
- Median household income benchmarks that highlight regional disparities in purchasing power.
- Educational attainment rates, showing a steady rise in the percentage of adults holding bachelor's degrees or higher.
- Employment and labor force participation rates that fluctuate based on economic cycles and local industry demands.
Housing and Infrastructure Pressures
With over 140 million housing units recorded nationwide, the demand for affordable shelter remains a central challenge. Population growth concentrated in specific metropolitan zones creates severe supply crunches, driving up rent and homeownership costs. Urban planners use these metrics to project infrastructure needs, from public transit systems to electrical grid capacities.
Common Misinterpretations of Census Data
Interpreting massive demographic datasets is tricky, and common pitfalls often lead to flawed conclusions about national trends.
- Confusing total population with labor force: A population of 331 million includes children, retirees, and individuals outside the traditional workforce. Economic policies cannot treat total headcounts as active workers.
- Assuming uniform growth: National growth averages hide local realities. While the country grows overall, hundreds of rural counties experience consistent population decline.
- Overlooking temporary anomalies: Decennial snapshots capture a single moment in time. Public health events, economic shocks, and policy shifts can alter migration and birth trends rapidly between official counts.
Frequently Asked Questions
How often does the U.S. Census Bureau count the population?
The official decennial census takes place every ten years, as mandated by the U.S. Constitution. Between these complete counts, the bureau uses annual surveys and administrative records to publish ongoing population estimates.
Why did population growth slow down during the 2010-2020 decade?
The slowdown resulted from a combination of declining birth rates, an aging population that naturally increased the death rate, and tighter restrictions or changing economic incentives surrounding international migration.
How do population statistics affect federal funding?
Federal agencies distribute hundreds of billions of dollars annually to state and local governments based on census data. These funds support infrastructure projects, Medicaid, school lunch programs, and community development grants.
What is the difference between the decennial census and the American Community Survey?
The decennial census is a complete count of every resident living in the United States, focused primarily on headcounts and basic demographic markers. The American Community Survey is an ongoing monthly survey sent to a sample of households to gather detailed social, economic, and housing data.