Measuring operational performance across different business units often feels like comparing apples to oranges. When one department operates on a multimillion-dollar budget and another runs on a lean startup allocation, raw output numbers lie. That's why leaders rely on specific comparative metrics rather than isolated totals.
The quotient metric solves this evaluation problem by establishing a clean, mathematically sound ratio between your inputs and outputs. Instead of asking how much revenue a division produced in total, you calculate the specific return generated per unit of resource spent. This approach cuts through organizational noise and exposes true operational health across every branch of your company.
Understanding the Quotient in Business Operations
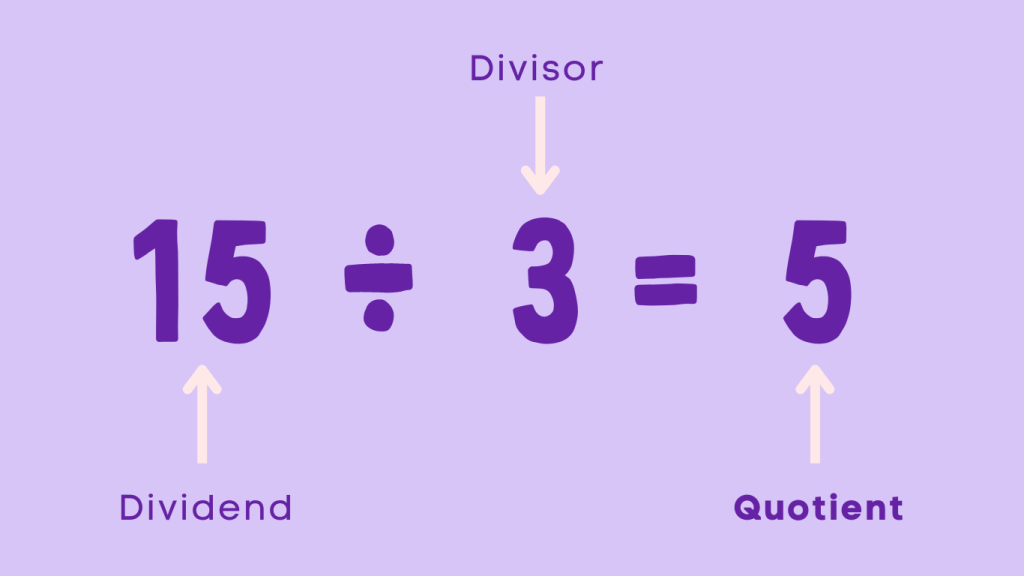
At its core, a quotient is simply the result of dividing one quantity by another. In a corporate setting, it represents the proportional relationship between two critical variables, such as total output divided by total resource consumption.
When you apply this concept to division management, you stop looking at vanity metrics. A large sales team might bring in massive gross revenue, but if their operational expenses outpace their returns, their efficiency quotient tanks. Conversely, a small three-person team might generate modest revenue while maintaining an exceptional performance quotient.
- Input variables: Labor hours, capital allocation, software licenses, and overhead expenses.
- Output variables: Units produced, customer acquisition counts, resolved support tickets, or net revenue.
- The resulting ratio: A clean number that lets you benchmark dissimilar departments objectively.
Why Raw Totals Fail Modern Organizations
Relying solely on gross totals creates a dangerous blind spot for executives. If Division A brings in ten million dollars while spending nine million, their net gain is slim. If Division B brings in two million while spending five hundred thousand, their proportional return crushes Division A's performance.
Traditional reporting often hides these discrepancies behind corporate scale. Larger departments command more resources simply because they existed longer or inherited legacy budgets. Evaluating performance through a quotient forces transparency. It asks whether every dollar and hour invested actually moves the needle.
Organizations that ignore efficiency ratios usually suffer from resource bloat. They keep funding underperforming sectors because those sectors look large on an organizational chart. Shifting focus to proportional output reveals where money leaks and where growth compounds.
Core Applications Across Corporate Divisions
Different departments require tailored metrics, but the underlying quotient logic applies universally. Let's look at how specific business units utilize these ratios to drive accountability.
Sales and Revenue Generation
Sales teams often track gross closed deals, but top performers look closer at acquisition efficiency. Your sales quotient compares total closed revenue against total outreach cost, including ad spend, travel, and base salaries.
If a regional team closes fifty accounts at a massive marketing expense, their return per dollar drops. Tracking this ratio ensures your expansion efforts actually scale profitably instead of burning cash to chase volume.
Customer Support and Service Delivery
Support divisions deal with variable ticket volumes daily. Measuring total resolved issues means nothing if response times drag and customer satisfaction plummets.
A functional support quotient measures successfully resolved tickets against total agent work hours. This ratio helps managers balance staffing levels without sacrificing service quality or burning out team members through unnecessary overtime.
Research and Development
Innovation is notoriously difficult to measure with standard accounting rules. However, R&D teams can track the quotient of successfully launched features or patented milestones against total project budgets and development sprints.
This ratio prevents endless engineering loops by tying resource expenditure directly to tangible market outputs. It forces teams to validate assumptions early rather than consuming budget indefinitely.
Common Pitfalls When Calculating Efficiency Ratios
While quotients provide clarity, misusing them ruins decision-making. Leaders frequently stumble into traps that distort their view of division success.
- Ignoring qualitative factors: A high output-to-input ratio means nothing if product quality collapses or employee turnover spikes. Always pair quantitative ratios with qualitative health checks.
- Comparing mismatched units: Never pit a customer service division against a software engineering team using the same exact efficiency formula. Context dictates the variables.
- Chasing short-term spikes: Optimizing a quotient for a single quarter often leads to cutting necessary long-term investments like infrastructure maintenance or staff training.
Implementing Quotient Tracking in Your Company
Integrating these performance ratios into your management cadence requires deliberate alignment. You can't simply drop new metrics on your team without context or clear definitions.
Start by auditing your current data collection methods. Ensure you track resource allocation with the same precision you track final revenue or output. If your expense reporting is messy, your ratios will point you in the wrong direction.
Next, establish baseline measurements across each division over a meaningful period, such as the past four quarters. Look for seasonal trends before setting strict performance targets. Share these metrics transparently with department heads so they understand how their daily operational choices impact the broader corporate strategy.
For further insights on structuring organizational performance frameworks, review guidance from U.S. Small Business Administration on operational management and resource planning. You can also examine corporate governance standards via OECD Business Operations.
Frequently Asked Questions
What is the main benefit of using a quotient metric over gross revenue?
Gross revenue only shows top-line volume, hiding the massive expenses required to generate it. A quotient metric measures efficiency by showing exact returns relative to resources consumed, revealing true profitability and operational health.
How often should leadership review these efficiency ratios?
Monthly reviews work well for operational tracking, while quarterly evaluations provide a better baseline for strategic adjustments. Reviewing too frequently can trigger knee-jerk reactions to normal short-term fluctuations.
Can small businesses use division-level quotients?
Yes. Even small companies with small teams benefit from dividing output by input to see which product lines, marketing channels, or service offerings truly drive growth relative to the time and money invested.
What causes a department's efficiency quotient to suddenly drop?
A sudden drop usually stems from scaling friction, such as onboarding too many new employees without adequate training, legacy software slowing down workflows, or increased overhead costs that outpace actual production gains.


