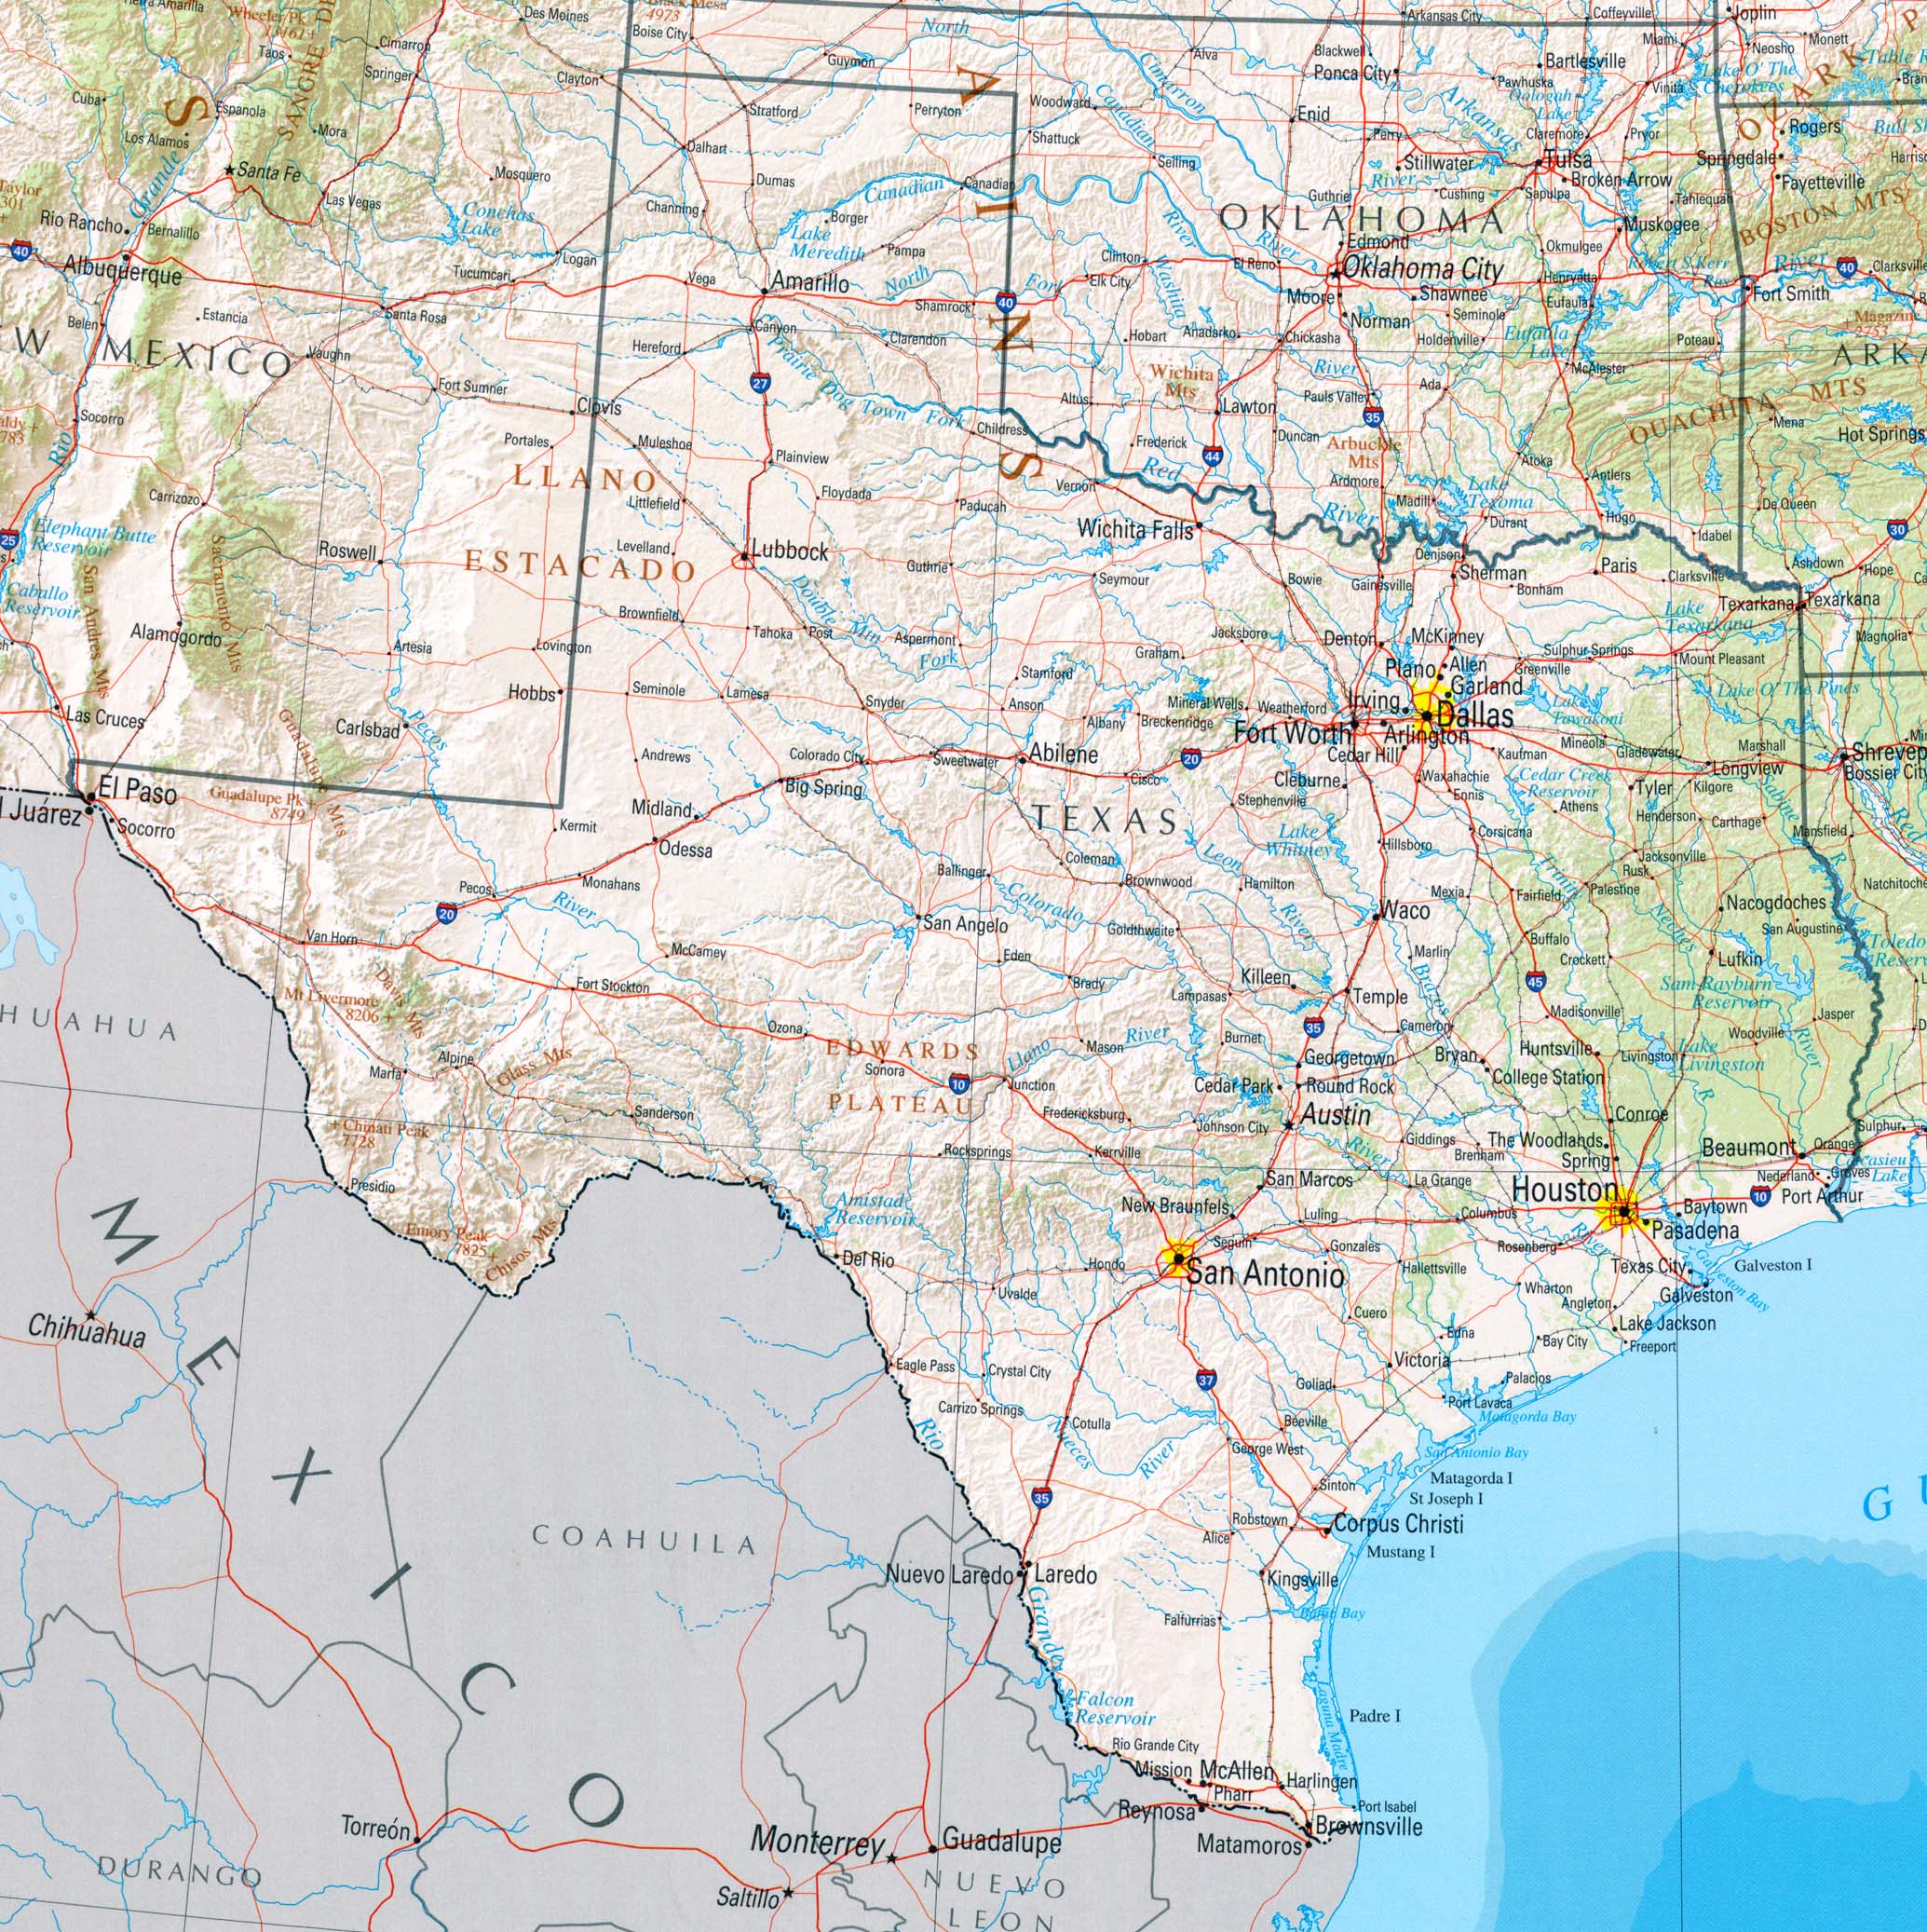
Navigating Texas homes on Zillow requires looking past automated estimates and understanding local market mechanics. The average Texas home value sits at $296,424, reflecting a modest year-over-year decline of 1.4%. While national headlines often paint broad strokes about southern migration, inventory levels, pricing corrections, and days-on-market vary wildly between Austin, Dallas, and rural counties.
If you're browsing listings across the Lone Star State, you need more than just a scrolling finger. You need a strategy to evaluate Zillow data accurately, interpret property history accurately, and spot genuine value before other buyers swoop in.
Decoding Zillow Data for the Texas Market
Online real estate platforms process millions of data points daily, but raw numbers can easily mislead prospective buyers and sellers. Understanding how platforms calculate metrics helps you separate marketing fluff from realistic valuation.
The Reality Behind Zillow Zestimates
The Zestimate is a starting point, not an appraisal. In diverse markets like Texas, automated valuation models often struggle with rapid neighborhood shifts, acreage variations, and custom builds.
- Algorithmic blind spots: Zestimates rely on public tax records and recent comparable sales. If your prospective home sits on two acres with a custom pool while neighboring properties are standard tract homes, the algorithm might misprice it significantly.
- Tax appraisal gaps: Texas is a non-disclosure state for property sales prices, meaning transaction prices aren't publicly recorded in real-time county databases. This lack of instant transparency forces automated models to rely on estimated valuations rather than closed MLS closing data.
- Historical delay: Market shifts take weeks to reflect in algorithmic updates. During a cooling trend, an automated value might lag behind actual market conditions.
Tracking Inventory and Days on Pending
Inventory across the state hovers around 161,000 active listings, giving buyers more breathing room than they had during the intense post-pandemic frenzy. Homes go to pending status in an average of 45 days.
When you track properties on portal listings, pay close attention to price drop history rather than initial list prices. A property that lingers past the 45-day mark often signals a motivated seller ready to negotiate concessions or repairs.
Regional Variations Across Texas Metros
Texas isn't a monolith. Treating Austin the same as Houston or San Antonio will cost you money. Each major metro operates under completely different economic drivers and inventory pressures.
Dallas-Fort Worth Dynamics
The average home value in Dallas rests at $303,442, dipping 1.4% over the past year. Homes in this metro typically move to pending in about 39 days. Suburbs like Frisco and Plano continue to see high buyer interest, while urban core properties experience steadier, more balanced pricing.
Houston Housing Realities
Houston remains one of the more affordable major metros, with a median home value of $259,465. Properties stay on the market for roughly 40 days. Because the sprawling layout creates micro-markets driven by local school districts and flood plain boundaries, mapping tools are essential to verify exact neighborhood boundaries.
Austin and Central Texas Corrections
After years of hyper-growth, Austin has experienced the most visible price adjustments in the state. Buyers who previously faced extreme competition now find sellers willing to negotiate on closing costs, inspection repairs, and interest rate buydowns.
Advanced Tactics for Portal Browsing
Anyone can type a city name into a search bar. Finding hidden gems requires using advanced filters and cross-referencing public records.
Filter Beyond Price and Bedrooms
Too many buyers limit their search to price and square footage, missing properties that have lingered due to poor marketing photos or vague descriptions.
- Turn on price history alerts: Track how long a home has sat on the market and whether previous pending sales fell through. A house back on the market after a failed option period can give you immediate leverage.
- Inspect parcel boundaries: Use map view layers to check proximity to major highways, commercial zoning, or flood zones—factors that rarely show up in standard listing descriptions.
- Monitor status changes closely: Properties switching from active to contingent frequently experience buyer financing fall-throughs, especially in higher interest rate environments.
Cross-Referencing With Official Data
Never rely solely on a portal's interface for critical decisions. Check county appraisal district records for true property tax histories, and consult local MLS data via a licensed agent to verify recent closed sales. For official housing economic reports and consumer guidance, you can review resources provided by the Texas Real Estate Research Center at Texas A&M University or check broader national housing context via the U.S. Department of Housing and Urban Development.
Common Mistakes Buyers Make Online
Portal browsing creates unique behavioral traps. Recognizing these pitfalls keeps your search objective and financially sound.
- Falling in love with renderings: New construction listings often feature digital staging or model home photos that do not match the specific lot or finish level of the available inventory.
- Ignoring property taxes: Texas has some of the highest property tax rates in the nation, often ranging between 1.6% and 2.5%+ depending on the MUD (Municipal Utility District) tax. A lower home price in a high-tax district can result in a higher monthly payment than expected.
- Skipping physical verification: Online photos hide neighborhood noise, power lines, and drainage issues. Always drive the neighborhood at different times of the week before submitting an offer.
Frequently Asked Questions
Why do Zillow prices differ from Texas county appraisal values?
County appraisal districts assess properties for tax purposes, often lagging behind market realities. Portals use automated valuation models based on recent listings and estimated square footage, which frequently diverge from actual transaction values in non-disclosure counties.
Are Texas home prices expected to keep dropping?
The market has largely stabilized following post-pandemic corrections, with minor year-over-year adjustments around 1% to 2% in major metros. Supply and demand remain balanced as steady migration into the state offsets higher borrowing costs.
How do I check if a Texas property is in a flood zone?
Portal maps provide basic boundaries, but you should verify exact flood risk using the FEMA Flood Map Service Center or local county engineering records, as insurance costs vary dramatically based on flood zones.
What should I look for in a Texas listing's price history?
Look for frequent price reductions, previous failed sales contracts, or long days on market. These indicators reveal seller motivation, allowing you to negotiate concessions like seller-paid rate buydowns.


