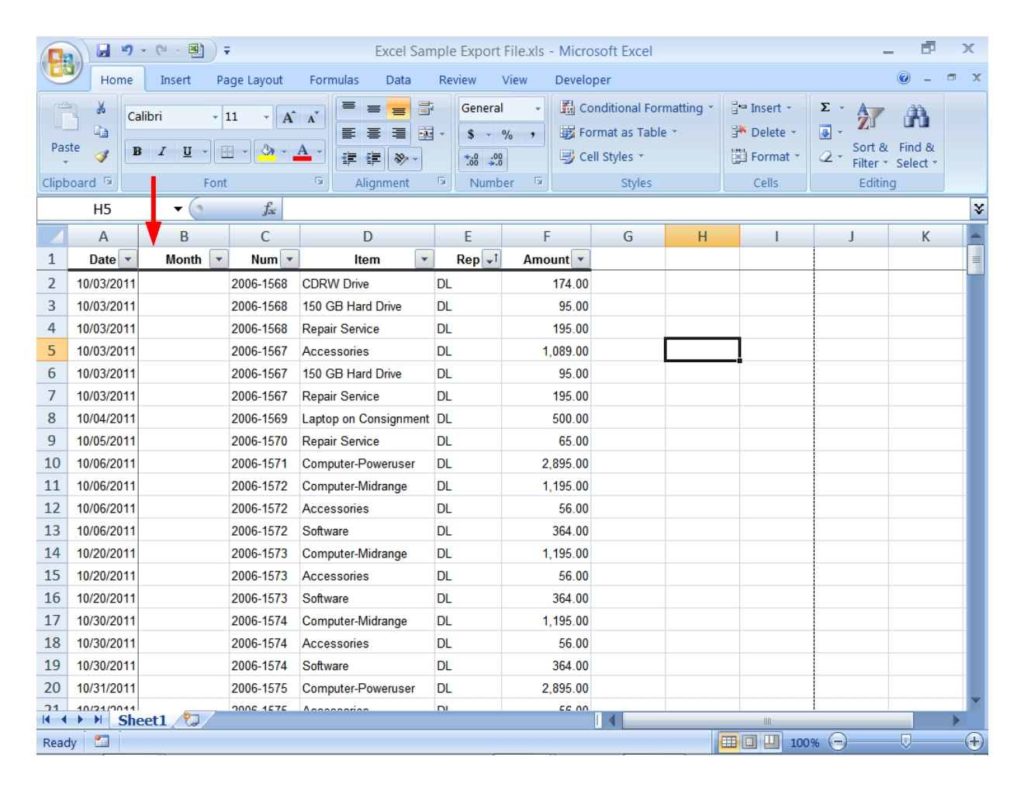
A spreadsheet is a digital grid of rows and columns designed to capture, organize, and calculate data. Unlike static text documents, it functions as an interactive workspace where numbers and formulas update instantly when source values change.
While its roots lie in manual paper accounting ledgers, today's spreadsheets power everything from small business inventory management to automated workflows and preliminary machine learning tasks. You'll find them in corporate boardrooms, classrooms, and freelance workflows because they require no programming background to start solving complex organizational problems.
The Technical Architecture of a Spreadsheet
At its core, a spreadsheet relies on a matrix framework built from intersecting columns (labeled with letters) and rows (labeled with numbers). The individual boxes at these intersections are cells, which serve as the fundamental unit of data storage.
Each cell holds a specific type of data:
- Raw values, such as text, numeric digits, or calendar dates.
- Formulas, which are mathematical expressions starting with an equals sign that perform calculations.
- Functions, which are pre-built computational shortcuts like SUM, AVERAGE, or VLOOKUP.
Multiple worksheets combine to form a workbook. This modular structure lets you reference cells across different sheets, allowing complex models to pull data from localized department tabs into a master financial summary.
From Ledger Books to Cloud Collaboration
The digital spreadsheet began in 1979 with VisiCalc on the Apple II computer. It transformed the personal computer from a hobbyist gadget into a serious office tool by automating financial projections. Instead of manually recalculating every row after changing a single cost variable, users could watch the entire sheet update in seconds.
Microsoft Excel arrived in 1985, cementing the grid format as the corporate standard through advanced formatting and Visual Basic for Applications (VBA) macro automation. Later, cloud-native platforms like Google Docs shifted the paradigm toward real-time collaboration. Multiple team members could edit the same workbook simultaneously without email version control conflicts.
Today, hybrid tools bridge the gap between traditional cells and relational databases. They offer custom views, file attachments, and API connectors directly inside the standard row-and-column interface.
Core Business and Financial Workouts
Finance remains the primary engine driving spreadsheet adoption. Professionals across industries rely on these grids for high-stakes forecasting and record-keeping.
Financial Modeling and Budgeting
Corporate finance teams build detailed financial models to project multi-year revenue, operating expenses, and cash flow. Changing a single assumption, such as an annual inflation rate or a subscription price increase, cascades through the entire model to reveal projected profitability. Similarly, department heads track monthly operational spending against approved allocations using conditional formatting to highlight over-budget line items automatically.
Data Analysis and Pivot Tables
When managing thousands of raw transaction rows, basic scanning fails. Pivot tables allow users to instantly group, filter, and summarize massive datasets without writing complex code. You can aggregate regional sales figures, isolate specific product categories, or spot seasonal purchasing trends within a few clicks.
Beyond Finance: Operations, Project Management, and AI
While accounting launched the spreadsheet revolution, modern workflows push the grid far beyond simple arithmetic.
- Inventory tracking: Small businesses use custom grids to monitor stock quantities, calculate automated reorder thresholds, and log supplier contact details.
- Project planning: Teams map out task dependencies, milestones, and resource allocations by treating columns as timelines and rows as operational deliverables.
- Personal finance: Individuals track net worth, map out debt payoff timelines, and manage household savings goals using reusable templates.
The Integration of Artificial Intelligence
Modern spreadsheet software incorporates machine learning directly into the user interface. Built-in intelligence assistants can analyze raw columns, spot statistical anomalies, and auto-generate charts upon request. Instead of memorizing complex formula syntax, users can type plain-language queries to generate summaries, sorting data instantly.
Common Spreadsheet Mistakes and Best Practices
The flexibility of a spreadsheet is its greatest strength and its most dangerous flaw. Because anyone can build a model without software engineering oversight, errors often hide in plain sight.
Common pitfalls include hardcoding values directly inside formulas, failing to document complex logic, and breaking cell references when inserting new rows. A single misplaced decimal point in a critical formula can cascade into major financial miscalculations.
To keep your work accurate and maintainable, follow these practices:
- Separate inputs from calculations by placing all raw user variables in a dedicated top or side section.
- Use uppercase for formula names and lowercase for cell references to maintain visual clarity.
- Apply rigorous error-checking tools to audit complex workbook dependencies before sharing final reports.
- Maintain strict version control protocols by utilizing cloud-native revision histories or date-stamped file naming conventions.
Frequently Asked Questions
What is the difference between a spreadsheet and a database?
A spreadsheet is designed for flexible, ad-hoc calculations and data visualization by a single user or small team. A database is engineered for secure, structured storage of millions of relational records accessed simultaneously by multiple applications.
Can spreadsheets handle big data?
Standard desktop spreadsheets experience severe performance degradation once datasets cross hundreds of thousands of rows. For massive datasets, professionals export data into dedicated SQL databases or use specialized cloud data warehouses.
Are macros and scripts the same thing?
Macros are recorded sets of actions or legacy VBA code designed to automate repetitive tasks in desktop applications. Modern scripts usually rely on languages like JavaScript or Python to connect spreadsheets with external web APIs and cloud services.
How do I prevent formula errors from breaking my sheet?
Wrap vulnerable formulas in error-handling functions like IFERROR to catch missing lookups or division-by-zero issues cleanly, ensuring your downstream dashboard displays cleanly.