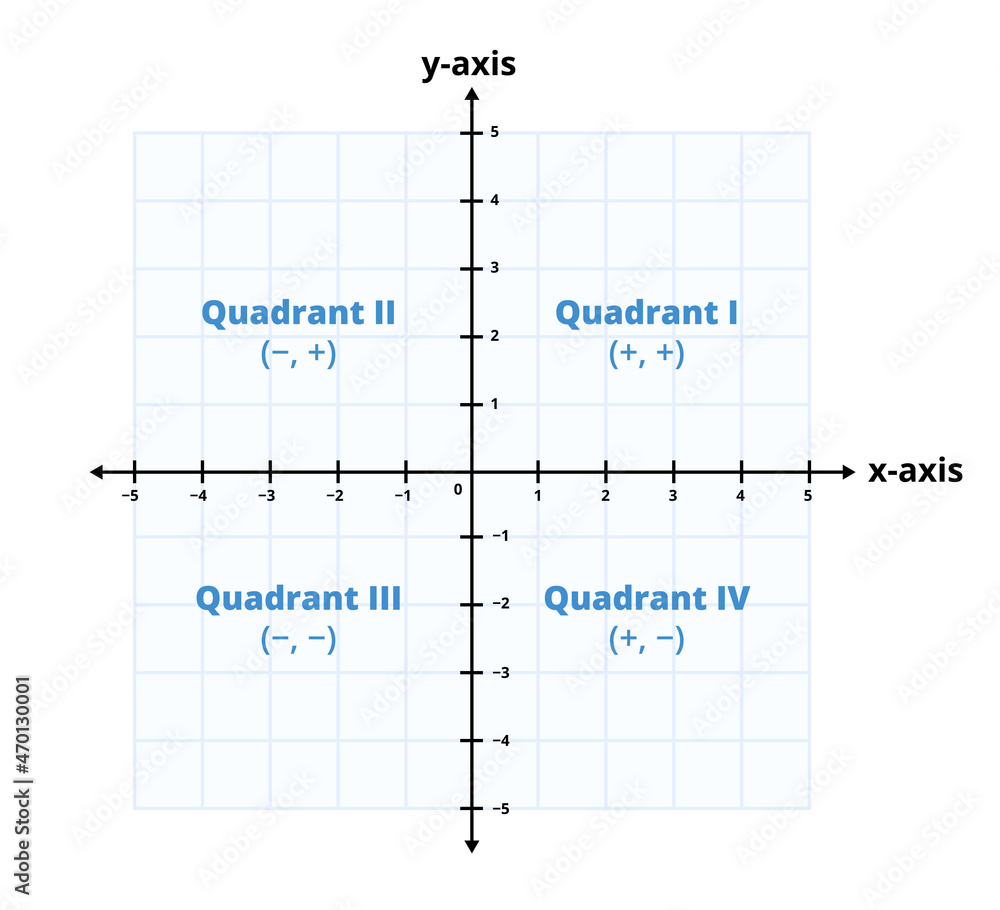
When you face a pile of conflicting data, your brain stalls. You don't need more information; you need a way to organize what's in front of you. Quadrants math gives you that structure by mapping variables onto two intersecting axes, turning an overwhelming mess into four clear categories.
This model cuts through noise by forcing you to pick two critical metrics and weigh them against each other. Instead of guessing, you see exactly where your options land. Whether you're sorting project backlog tasks or weighing financial risks, this grid makes complex choices manageable in seconds.
The Core Structure of Quadrants Math
At its simplest, this framework is a coordinate plane divided into four distinct regions. You draw a horizontal axis and a vertical axis, creating an origin point in the center. Each axis represents a specific variable that matters to your current goal, such as cost versus value, or urgency versus impact.
You aren't doing calculus or solving algebraic equations here. You're using spatial reasoning to categorize qualitative or quantitative inputs.
- Select two opposing or complementary drivers: Choose metrics that genuinely conflict or create healthy tension.
- Establish your thresholds: Decide where the median or cutoff falls for each axis to form the four quadrants.
- Plot your variables: Drop your ideas, projects, or problems into the matching zone based on their scores.
- Evaluate the clusters: Look at where items pile up and decide what action each zone demands.
When you map information this way, blind spots jump out immediately. A project that feels urgent might actually land in a low-impact quadrant, saving you weeks of wasted effort.
How to Apply the Framework in Business and Finance
Financial analysts and business leaders use these grids to manage risk and capital allocation without getting lost in spreadsheets.
Imagine evaluating a portfolio of potential investments. You set your horizontal axis to market volatility, running from low to high. Your vertical axis tracks expected return, also running from low to high.
- Low Volatility, Low Return: Safe, defensive assets like government bonds that protect capital.
- Low Volatility, High Return: Rare arbitrage opportunities or undervalued assets that offer steady growth with minimal turbulence.
- High Volatility, Low Return: Distressed securities or declining assets you should avoid.
- High Volatility, High Return: Growth stocks or speculative ventures requiring careful position sizing.
By sorting assets into these zones, you stop treating every investment the same way. You build a balanced portfolio because you can see the trade-offs at a glance. You aren't guessing if an asset fits your risk tolerance; the map tells you.
Prioritizing Tasks in Product Development
Engineering and product teams lean heavily on a specific version of this framework: the effort-versus-impact matrix. When your backlog has fifty feature requests, arguing about them individually wastes days.
Instead, you plot every request on two axes. The horizontal axis measures implementation effort, while the vertical axis measures user impact.
- Quick Wins (High Impact, Low Effort): Build these first. They deliver maximum value for minimal resource drain.
- Strategic Bets (High Impact, High Effort): Plan these carefully. They require heavy investment but define your product's future.
- Fill-Ins (Low Impact, Low Effort): Tackle these only when your team has idle time between major projects.
- Thankless Tasks (Low Impact, High Effort): Drop these immediately. They drain morale and budget for no tangible return.
Using this grid removes personal ego from product planning. When someone pushes for their favorite feature, you simply ask where it lands on the impact-effort grid.
Common Mistakes When Building Your Grid
People often fail with this framework because they rush the setup phase. If your foundation is sloppy, your decisions will be wrong.
One major error is picking interdependent axes. If your two metrics measure the exact same thing, your variables will just form a diagonal line across the grid, rendering half the space useless. Your axes must represent genuinely distinct dimensions of the problem.
Another mistake is overloading a single quadrant. If twenty out of twenty-five items land in the top-right box, your thresholds are too low. You need to adjust your median points so the framework actually forces hard choices.
Finally, treat your grid as a living document. Market conditions shift, and a project that was a quick win six months ago might now be a thankless task. Revisit your mapping regularly.
Frequently Asked Questions
Is quadrants math an actual branch of mathematics?
No. It borrows coordinate geometry concepts from math, but it functions primarily as a mental model and decision-making framework for strategic analysis.
How many variables can I include in a single grid?
You can only plot two variables on a standard two-dimensional grid. If you need to evaluate a third variable, you have to create a separate grid or use a different analytical model like a scoring matrix.
What if my data points fall right on the axis line?
Treat the axis as a boundary condition. Re-evaluate the item or refine your threshold definitions slightly to push it into one of the four actionable zones.
Can I use this framework for personal decisions?
Yes. You can plot career choices using axes like personal fulfillment versus financial compensation to clarify your next career move.