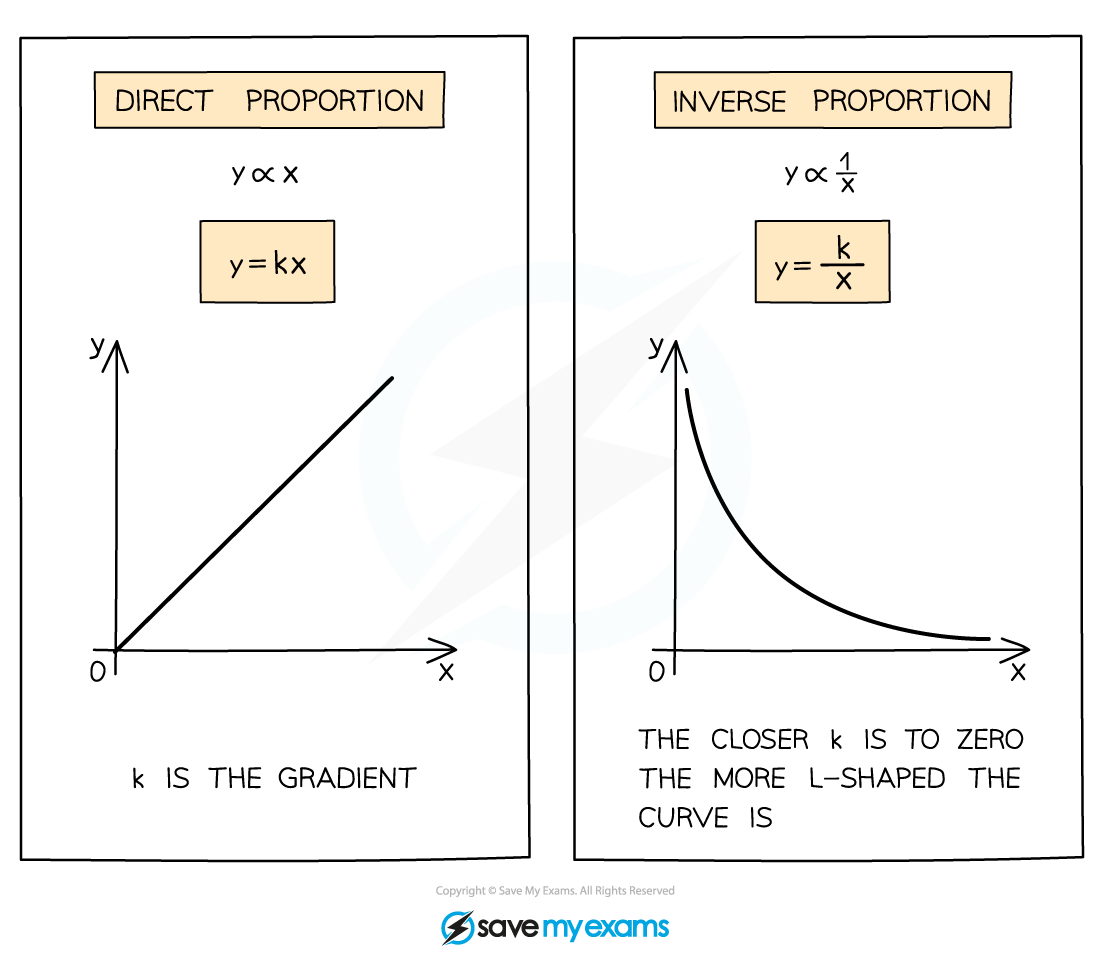
When two quantities maintain a constant relative ratio, we call it a proportional relationship. If you double one value, the other doubles too. If you triple one, the other triples right along with it. This predictable behavior forms the backbone of algebra, geometry, and countless everyday calculations, from scaling a recipe to calculating highway mileage.
At the heart of every proportional relationship lies a multiplier known as the constant of proportionality. Once you find this number, you can predict unknown values, graph linear equations that pass straight through the origin, and solve complex word problems with ease. Let's break down how these relationships work, how to calculate the constant, and where you'll encounter them in the real world.
Understanding Proportional Relationships
A proportional relationship exists when two variables have a constant ratio. Imagine you're buying bulk apples at the grocery store for two dollars per pound. One pound costs two dollars, two pounds cost four dollars, and five pounds cost ten dollars. The ratio of cost to weight remains fixed at two over one.
We write this algebraic relationship as $y = kx$, where $k$ represents the constant of proportionality. If $y$ is the total cost and $x$ is the weight in pounds, $k$ is the unit price of two dollars.
To prove whether two sets of numbers form a proportional relationship, check if their ratios are equivalent. If you divide any $y$ value by its corresponding $x$ value, the quotient must always equal the exact same number. If that quotient changes even slightly, the relationship isn't proportional.
Direct Variation vs Proportionality
Many students confuse direct variation with general proportionality. Every direct variation is a proportional relationship, but they share specific structural rules. A direct variation is defined by the equation $y = kx$ where $k$ does not equal zero.
Crucially, the graph of a proportional relationship must always pass through the coordinate point zero, zero. If you buy zero pounds of apples, you pay zero dollars. If a pricing model includes a fixed initial delivery fee, like a five-dollar base charge plus two dollars per pound, the relationship ceases to be proportional because the line intercepts the y-axis above the origin.
Decoding the Constant of Proportionality
The constant of proportionality is the unchanging factor that relates two variables. You'll often see it represented by the letter $k$. Finding $k$ is straightforward if you have a data table, a graph, or an equation.
To find $k$ from a table of values, pick any pair of coordinates where $x$ does not equal zero. Divide $y$ by $x$. $$\frac{y}{x} = k$$ If you're looking at a graph, find a clear point where the line crosses grid intersections. Take the y-coordinate of that point and divide it by the x-coordinate. On a graph, $k$ also represents the slope or steepness of the line. A larger $k$ value means a steeper line, indicating that the dependent variable grows much faster relative to the independent variable.
Step-by-Step Calculation Example
Suppose you travel at a steady speed on a road trip, driving one hundred and twenty miles in two hours. You want to find the constant of proportionality relating distance to time.
- Identify your variables. Let $y$ represent the distance in miles, and let $x$ represent the time in hours.
- Set up the ratio of distance to time: $120 \div 2$.
- Calculate the quotient: $120 \div 2 = 60$.
- Write the final constant: $k = 60$ miles per hour.
- Formulate the equation for future calculations: $y = 60x$.
With this equation, if you drive for five and a half hours, you simply multiply sixty by five point five to find you've traveled three hundred and thirty miles.
Proportional vs Non-Proportional Relationships
Spotting the difference between proportional and non-proportional relationships prevents costly errors in math and science. Let's compare their core characteristics.
A proportional relationship features a constant unit rate, a graph that forms a straight line passing through the origin, and an equation structured strictly as $y = kx$.
A non-proportional relationship might still form a straight line, but that line crosses the y-axis at a value other than zero. This is slope-intercept form, written as $y = mx + b$, where $b$ represents the y-intercept. Alternatively, non-proportional relationships can be non-linear, meaning the variables change at an accelerating or decelerating rate, such as exponential growth or quadratic curves.
Consider gym memberships. Gym A charges ten dollars per month with no signup fee. That's proportional. Gym B charges five dollars per month plus a fifty-dollar joining fee. That's non-proportional because the initial fee breaks the clean ratio between total money spent and months elapsed.
Real-World Applications
Proportionality isn't just an abstract classroom concept. You use it every day without realizing it.
When you scale a cooking recipe that serves four people up to serve ten, you multiply every ingredient by the same scaling factor. That factor is your constant of proportionality.
Financial calculations rely heavily on these principles. Currency exchange rates use a constant multiplier. If one US dollar trades for a specific amount of another currency, converting your money is a direct multiplication problem. Similarly, calculating sales tax or simple interest involves proportional scaling.
For instance, when reading USAGov financial resources or calculating tax withholdings set by the Internal Revenue Service, understanding ratios helps you verify calculations and budget accurately. In physics and engineering, formulas like Ohm's Law or simple speed-distance-time calculations depend entirely on proportional constants to model physical phenomena reliably.
Common Mistakes to Avoid
Even advanced math students stumble on proportionality pitfalls. Watch out for these frequent errors:
- Forgetting the origin rule: Assuming a linear graph is proportional just because it's a straight line. If it doesn't cross zero, zero, it's not proportional.
- Flipping the variables: Dividing $x$ by $y$ instead of $y$ by $x$ when finding $k$. Always check which variable depends on the other. Cost depends on weight, so cost is $y$ and weight is $x$.
- Assuming consistency blindly: Using a single data point from a complex data set without verifying if the ratio remains constant across other rows in a table.
- Confusing ratios with percentages: Treating percentage increases as simple proportional multipliers when compound growth or base shifts are involved.
Frequently Asked Questions
Can the constant of proportionality be a negative number?
Yes. If one variable increases while the other decreases at a steady rate, the constant of proportionality will be negative. This creates a line that slopes downward from left to right while still passing through the origin.
How do you know if a table shows a proportional relationship?
Calculate the unit rate for every single row by dividing $y$ by $x$. If every single calculation yields the exact same number, the table represents a proportional relationship. If even one pair yields a different quotient, it does not.
Why doesn't a proportional relationship ever have a y-intercept greater than zero?
By definition, a proportional relationship means that when the independent variable is zero, the dependent variable must also be zero. A non-zero y-intercept introduces a fixed starting value or flat fee, which breaks the pure multiplicative ratio.
Is a constant rate of change the same thing as a constant of proportionality?
Not quite. Every constant of proportionality is a constant rate of change, but not every constant rate of change is proportional. A linear equation with a y-intercept has a constant rate of change, but it lacks the direct proportionality required for simple scaling.


