When studying human geography or demographic trends, it's easy to mix up population density and population distribution. While both metrics evaluate how people occupy space, they answer completely different questions.
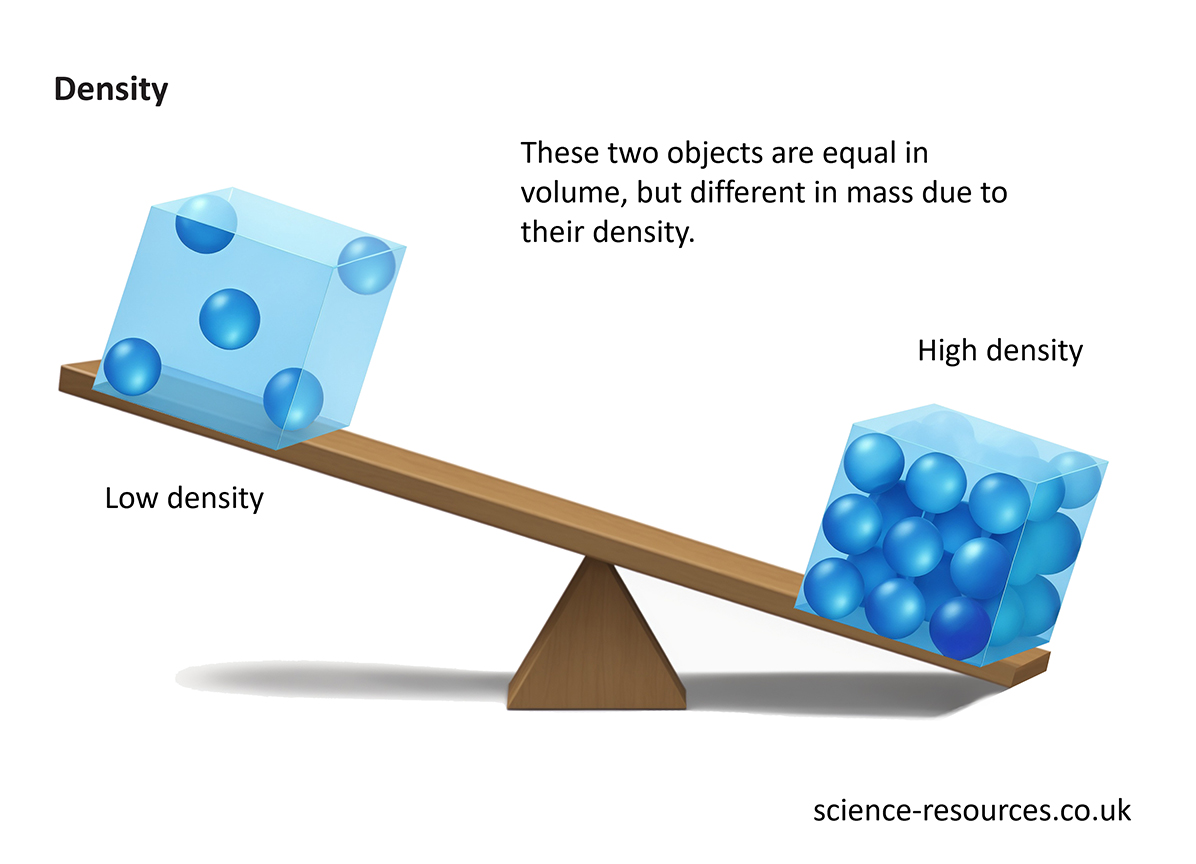
Population density measures how crowded a specific area is, expressed as a numerical ratio like individuals per square kilometer. Population distribution maps the actual spatial pattern of where those people are located across a region, showing whether populations cluster tightly or spread out evenly. Knowing the distinction helps urban planners, demographers, and policy makers interpret census data accurately without jumping to false conclusions about regional crowding.
Defining Population Density
Population density calculates the concentration of individuals within a defined boundary. Demographers compute this metric by dividing total population by total land area.
For example, if a municipality has 50,000 residents living across 10 square kilometers, its population density is 5,000 people per square kilometer. This numeric value tells you the average physical packing of a community, but it hides crucial local variations.
Common ways to analyze density include:
- Arithmetic density: Total population divided by total land area, offering a broad macro-level overview.
- Agricultural density: The number of farmers relative to arable (farmable) land, showing efficiency and food security constraints.
- Urban density: The concentration of inhabitants strictly within municipal city limits or metropolitan cores.
High density doesn't automatically mean economic distress. For instance, both Monaco and Bangladesh feature extreme population densities, yet their economic profiles and infrastructures differ entirely. Density simply establishes the raw math of human presence in a zone.
Defining Population Distribution
Population distribution describes the arrangement or pattern of human settlement across the Earth's surface. Instead of yielding a single numerical ratio, distribution maps out where human populations thrive, cluster, or avoid entirely.
Human populations are fundamentally uneven. People gravitate toward flat terrain, temperate climates, coastal zones, and fertile river valleys, leaving arid deserts, high mountain ranges, and polar ice caps largely vacant.
Geographers categorize these broad spatial patterns into three main structural types:
- Clumped distribution: People gather in concentrated hubs, such as major metropolitan areas, industrial corridors, or coastal mega-regions.
- Uniform distribution: Settlements maintain relatively regular distances from one another, often seen in planned agricultural grid systems or specific suburban layouts.
- Random distribution: Settlements lack an overarching predictable geometric order, often appearing in remote rural homesteads where individual property choices dictate placement.
Core Differences at a Glance
Confusing these two metrics leads to flawed resource allocation. Reviewing their core traits side by side clarifies their distinct functions.
- Primary Question: Density asks how many individuals occupy a unit of space, while distribution asks where and how those individuals are arranged.
- Data Output: Density yields a hard numerical statistic (e.g., 400 people/km²), whereas distribution yields a spatial layout description or map pattern (e.g., coastal clustering).
- Scale Sensitivity: Density can change drastically depending on how small or large you draw the boundary box. Distribution highlights structural patterns regardless of boundary adjustments.
- Core Utility: Density helps governments calculate immediate infrastructure strain, such as sewer capacity or school sizes. Distribution helps historians and planners understand migration drivers, climate adaptation, and regional economic disparities.
Real-World Impact on Policy and Planning
Governments use both metrics to manage public services, yet they rely on them for entirely different operational goals.
When a city transit authority evaluates subway expansion, they look closely at population density along specific corridors. High density justifies high-capacity rail lines because rider volume will cover operational costs.
Conversely, when a national government plans emergency disaster response or telecommunications rollout, distribution metrics take priority. Knowing that a population is heavily clumped in coastal flood zones or scattered across remote mountainous terrain dictates where relief depots or fiber-optic networks must go. Relying on average density alone would cause planners to miss vulnerable isolated pockets entirely.
Common Mistakes in Demographic Analysis
Analysts often trip over a few common pitfalls when interpreting population data. Avoiding these errors ensures cleaner research and better strategic planning.
- Assuming uniform density within a border: Treating an entire country or state as having uniform density hides massive internal discrepancies. A nation might have a low overall density while possessing hyper-dense urban cores.
- Confusing cause and effect: High density is frequently the result of positive economic factors like job abundance, not a forced condition. Mistaking density for overpopulation ignores historical settlement patterns.
- Ignoring seasonal fluctuations: Standard census counts capture static distribution, missing tourism shifts, migrant farmworker influxes, or commuter flows that temporarily alter local density metrics.
For official demographic frameworks and global census standards, you can review guidelines provided by the United Nations Population Division. For domestic geographical datasets, consult the U.S. Census Bureau.
Frequently Asked Questions
Can two regions have the exact same density but different distributions?
Yes. Two different counties might each house 10,000 residents across 100 square kilometers, resulting in an identical density of 100 people per square kilometer. However, County A might feature all 10,000 residents packed into a single downtown town-center (clumped distribution), while County B has residents evenly spaced out on farmsteads across the entire region (uniform distribution).
Why is population distribution globally uneven?
Human settlement depends heavily on physical and economic variables. Water access, arable soil for agriculture, temperate weather, and employment centers attract large numbers of people, while extreme cold, arid deserts, and rugged mountains restrict habitation.
How does urbanization affect population density and distribution?
Urbanization pulls people away from rural, dispersed settings into concentrated urban cores. This migration lowers rural distribution density while dramatically spiking urban density, fundamentally reshaping a nation's spatial layout within a few decades.
Which metric is more useful for environmental impact studies?
Both are necessary. Density shows the immediate local strain on local resources like water and waste management, while distribution maps out the broader footprint of human activity across sensitive ecosystems and wildlife corridors.