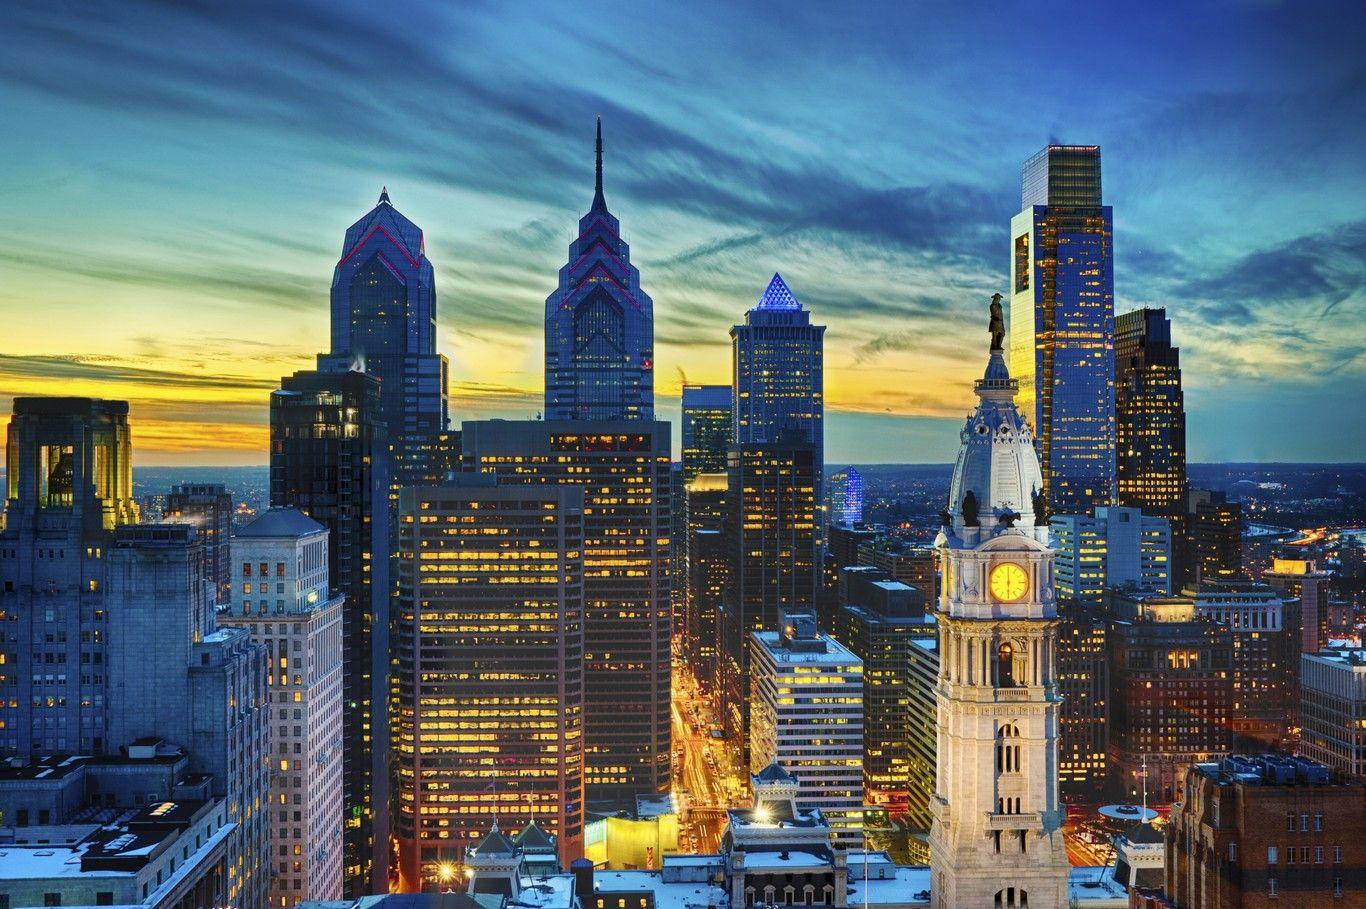
Predicting weather in Philadelphia isn't just about checking a single temperature for the whole metropolis. Because the city spans distinct microclimates—from the urban heat island of Center City to the river-moderated banks of the Schuylkill and Delaware rivers—standard regional forecasts often miss local variations. Using platforms like Weather Underground gives residents access to hyper-local data through a massive network of Personal Weather Stations (PWS). If you want to know if it's actually flooding on Kelly Drive or snowing in Chestnut Hill, standard airport feeds won't always tell you the whole story.
The primary challenge of forecasting weather in the City of Brotherly Love lies in its geography. Nestled in the Delaware Valley, Philadelphia experiences distinct seasonal shifts, coastal nor'easters, and sudden summer convective storms that behave differently across neighborhoods. Relying solely on official National Weather Service reports from Philadelphia International Airport (KPHL) can leave you unprepared if you live miles away uphill or closer to the waterfront. This guide breaks down how to harness hyper-local networks, read radar layers accurately, and interpret localized data to predict conditions across Philadelphia neighborhoods.
Understanding Philadelphia Microclimates and Weather Patterns
Philadelphia features a humid subtropical climate characterized by hot, humid summers and cold winters. Yet, concrete density and proximity to waterways create sharp temperature gradients within a very small radius.
Center City traps heat efficiently. Pavement, high-rise buildings, and heavy traffic create an urban heat island effect. During summer heatwaves, ambient temperatures in Rittenhouse Square or Society Hill can easily run three to five degrees warmer than suburban green spaces or valley areas along the Wissahickon.
Conversely, winter nor'easters bring distinct precipitation puzzles. A storm moving up the Atlantic coast might pump warm air off the ocean, turning snow to sleet or heavy rain in South Philadelphia, while neighborhoods in Northwest Philly like Chestnut Hill or Roxborough stay cold enough to accumulate several inches of heavy, wet snow. Recognizing these localized elevation and thermal differences is the first step to accurate forecasting.
Leveraging Personal Weather Stations for Hyper-Local Accuracy
The core strength of Weather Underground is its crowdsourced network of private weather stations. While official stations give baseline metrics, PWS units fill in the gaps down to the neighborhood block.
- Center City Nodes: Track urban canyon wind tunneling and trapped heat radiation.
- River Valley Sensors: Monitor ground fog risks and rapid humidity spikes near the Schuylkill and Delaware rivers.
- Elevated Northwest Sensors: Catch early freezing temperatures and snowfall gradients tied to higher terrain.
When you open the platform for Philadelphia, don't just look at the default city icon. Click on individual PWS flags scattered across neighborhoods like Fishtown, West Philadelphia, and South Philly. You'll notice variance in wind gusts, exact rainfall totals, and barometric pressure drops.
Reading Pressure Trends and Radar Layers
Accurate short-range forecasting requires watching barometric pressure trends rather than just current conditions. When cold fronts sweep down from the Poconos or low-pressure systems track up from the Chesapeake Bay, air pressure drops rapidly.
If you notice barometric pressure falling steadily over a three-hour window alongside rising humidity, a sudden convective downpour is likely heading east toward the city. Use the WunderMap feature to layer NEXRAD radar imagery with wind vectors. Observing the velocity layer helps you track severe squall lines moving across Montgomery and Delaware counties before they slam into Center City.
Common Mistakes When Forecasting Local Weather
Amateur forecasters often fall into predictable traps when evaluating incoming storms in Philadelphia. Avoid these common missteps to improve your predictive accuracy:
- Trusting a single data point: Relying only on airport readings ignores how urban density alters wind speed and localized heat.
- Ignoring dew point trends: In summer, a rising dew point above 65 degrees Fahrenheit signals oppressive humidity and a high risk of pop-up afternoon thunderstorms.
- Disregarding terrain differences: Assuming sea-level precipitation totals apply equally to higher-elevation neighborhoods during marginal winter storm setups.
- Failing to check radar loops: Looking static images instead of animated loops means missing the trajectory and speed of fast-moving squall lines.
Frequently Asked Questions
Why does the temperature in my neighborhood differ from the official forecast?
Official forecasts usually pull data from Philadelphia International Airport. Inland neighborhoods, elevated terrain, and heavy urban concrete structures create microclimates that fluctuate by several degrees.
How do I find the closest weather station to my house?
Open the interactive map view on the platform, zoom in on your specific neighborhood, and click the active icons representing local sensor nodes to view hardware specs and real-time feeds.
Can I trust data from amateur weather stations?
Most units on the network are automated and filtered for quality control, but you should check station reliability ratings and compare a few nearby nodes to spot outliers caused by improper sensor placement.
How do nor'easters uniquely impact Philadelphia weather?
Nor'easters pull moisture from the Atlantic, often stalling over the Mid-Atlantic. Depending on the exact track of the storm center, Philadelphia can experience everything from freezing rain to heavy coastal flooding along the Delaware River.
For official regional advisories and safety warnings, cross-reference your neighborhood observations with the National Weather Service Philadelphia/Mount Holly office, which provides detailed forecast discussions and severe weather alerts.



