Navigating changing weather conditions across the five boroughs requires more than a quick glance out the window. Whether you're commuting through Manhattan or managing logistics in Brooklyn, tracking real-time meteorological data depends heavily on interpreting specialized radar networks. Understanding how precipitation patterns appear on your screen helps you anticipate downpours, severe squalls, and winter snow bands before they disrupt your day.
The primary instrument covering the metropolitan area is the National Weather Service radar installation, designated as KOKX, located nearby in Upton, New York. This system bounces radio waves off atmospheric particles, translating returned signals into actionable visual data. For residents and daily commuters, this means radar imagery refreshes continuously, providing a dynamic look at approaching storm cells rather than a static snapshot.
How to Read Precipitation Intensity
When you open a live radar map, you'll see a spectrum of colors overlaid on a geographic map of the city. These color gradients correspond to specific measurements of energy reflected back to the radar station, known as reflectivity, measured in decibels relative to z (dBZ).
- Light Green: Indicates light rain or drizzle. In winter months, this often signifies light, manageable snow flurries. Visibility remains mostly unaffected, and travel delays are rare.
- Yellow to Orange: Represents moderate to heavy rainfall. Traffic speeds typically drop on regional highways during these periods, and outdoor activities become uncomfortable. In winter, this range points to heavy snow bands that can quickly accumulate on unplowed streets.
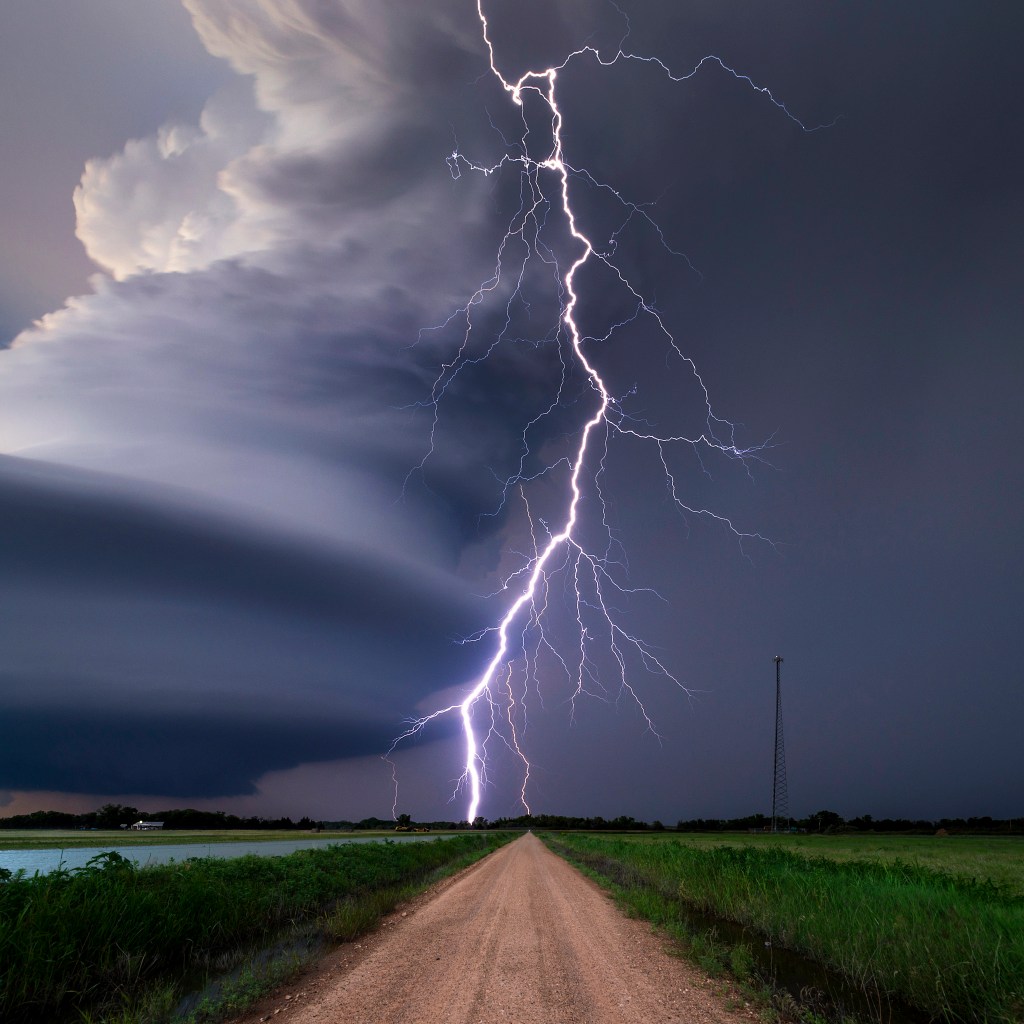
- Red: Signifies intense thunderstorms, torrential downpours, or embedded convective activity. Expect gusty winds, frequent cloud-to-ground lightning, and possible localized street flooding in low-lying urban areas.
- Purple: Points to extreme weather potential, frequently associated with heavy hail or severe convective wind gusts. While hail is less common in the immediate urban core than in open plains, purple signatures demand immediate caution.
Key Limitations of Local Radar Mapping
Relying solely on a mobile app map can occasionally lead to miscalculations. Radar beams travel outward in a straight line while the Earth curves away beneath them. This means the radar beam samples the atmosphere several thousand feet above the ground once it moves far from the transmitter.
Because of this elevation, what appears as heavy rain on a screen might actually evaporate before reaching the pavement, a phenomenon known as virga. Conversely, very low-level drizzle or fog occurring right at street level may fly completely beneath the radar beam's lowest scanning angle. Cross-referencing radar loops with automated surface observing systems at Central Park or local transit hubs helps confirm whether precipitation is actually hitting the ground.
Another common urban artifact is ground clutter. High-rise buildings across Manhattan and surrounding boroughs can reflect the radar beam, creating permanent false echoes or artificial "holes" in the data stream. Experienced users look for motion over time rather than trusting a single frame, because stationary blobs near skyscraper zones are often architectural reflections rather than actual storm clouds.
Practical Steps for Monitoring Approaching Storms
To get the most accurate picture of an incoming weather system, follow a consistent observation workflow:
- Watch the loop sequence: Observe at least three to four consecutive frames to determine the actual direction and speed of the storm front. Storms in the region typically move from west to east or southwest to northeast.
- Check velocity data: Advanced radar views offer radial velocity maps, which track whether winds are moving toward or away from the radar site. A sharp transition from green to red within a tight space indicates rotation, signaling potential severe wind shear.
- Monitor official alerts: Radar apps show where storms are, but official National Weather Service warnings provide the legal context and urgency required during severe weather outbreaks.
Frequently Asked Questions
How frequently does radar data update?
Standard radar imagery updates every two to six minutes, depending on the volume scan mode currently active at the transmitting station. During severe weather alerts, the system frequently shifts to faster scanning modes to provide more frequent updates.
Why do different weather apps look different?
Different platforms apply distinct processing algorithms to raw radar data. Some apps smooth the pixel edges for a cleaner visual interface, while others display raw data grids that look more pixelated but retain higher technical accuracy.
Can radar predict exact snow accumulation totals?
No. Radar measures reflectivity in the atmosphere, not snow depth on the ground. Winter precipitation ratios vary based on temperature profiles, meaning a heavy-looking radar signature can produce vastly different snow depths depending on how wet or dry the snowflakes are.
What causes a sudden gap in a storm on the radar map?
If a storm appears to split or form a clear hole while passing over a dense urban area, it is frequently due to beam blockage caused by tall buildings or terrain interference rather than an actual break in the storm.



