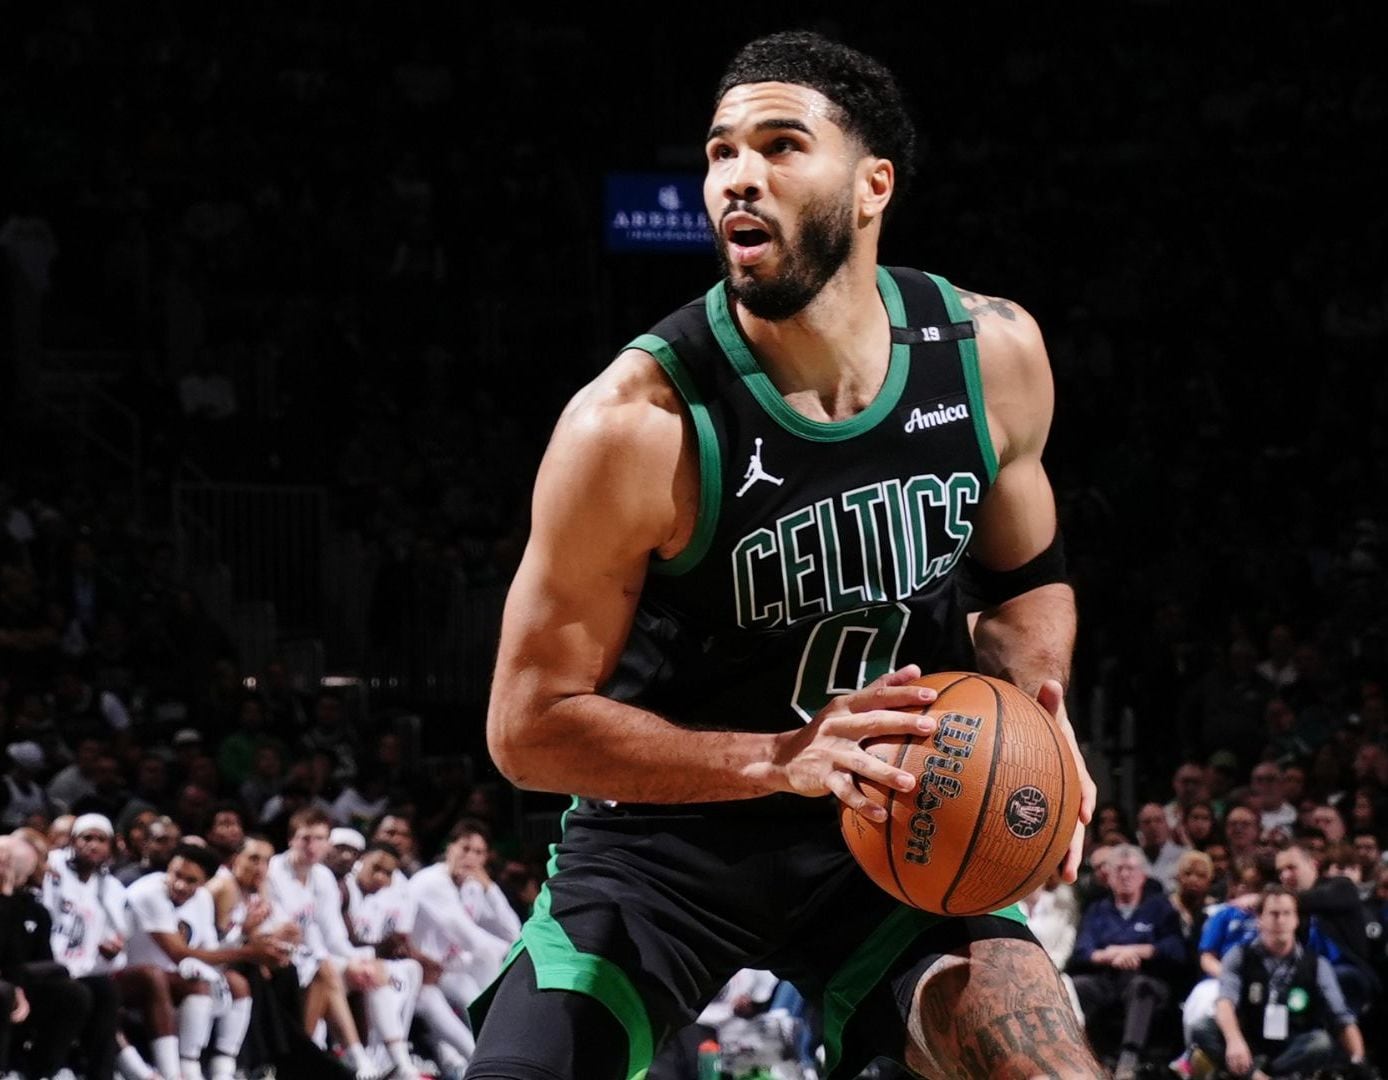
NBA defenses don't operate as monolithic units. A franchise might lock down the paint with an elite rim protector while simultaneously hemorrhaging wide-open perimeter looks to opposing guards. NBA defense vs position data breaks down these vulnerabilities, tracking exactly how many points, rebounds, and assists every team allows to specific floor slots. Relying on overall defensive rating hides these granular cracks. By analyzing positional vulnerabilities instead, you isolate real mismatches for fantasy lineups and player prop bets.
Understanding this metric requires looking past raw box scores into defensive schemes, pace adjustments, and sample size distortions. Teams playing aggressive drop coverage handle pick-and-rolls differently than switching defenses, creating distinct statistical footprints for opposing point guards and centers. Let's break down how these factors interact and how to apply them effectively.
Decoding the Core Metrics of DvP
Defense versus position (DvP) data typically arrives in a grid or cheat sheet format, showing raw stats or fantasy points allowed per game to point guards, shooting guards, small forwards, power forwards, and centers. However, raw averages can deceive.
If a squad faces a string of low-scoring bench guards early in the season, their raw DvP numbers against point guards will look artificially stingy. Sharp analysis requires adjusting for opponent quality and game pace.
- Points Allowed: The most direct indicator of soft perimeter defense or weak interior resistance. Bottom-five defenses at a specific position regularly surrender three to six more points per game than league average.
- Rebounding Yields: Tracks how frequently a team gives up second-chance opportunities or fails to box out. Teams playing small-ball lineups often inflate rebounding totals for opposing traditional centers.
- Assist Concessions: Correlates heavily with defensive scheme. Teams that trap or double-team primary ball-handlers often scramble and give up open corner threes or dump-offs, driving up opponent assists.
The Role of Defensive Schemes
Schemes dictate where shots originate on the floor, directly shaping positional stat lines. You can't evaluate a matchup without knowing how a coaching staff defends ball screens and post-ups.
Drop Coverage vs. Switching
When a team runs drop coverage, their center drops back toward the rim to stop penetration. This strategy protects the paint but invites pull-up mid-range jumpers and floaters from opposing point guards. Conversely, a heavy switching scheme forces big men onto the perimeter, often exposing slower centers to shifty guards who can blow past them or step back for threes.
Perimeter Containment and Help Defense
Teams that play an aggressive help-and-recover style often scramble out of rotation, leading to high three-point volume for opposing wings. If a small forward faces a defense that collapses hard on drives without recovering quickly, their three-point prop or catch-and-shoot volume spikes.
Combining DvP with Pace and Usage
DvP in isolation is only half the puzzle. True analytical edge emerges when combining position data with team pace and player usage rates.
Favorable DvP Matchup + High Game Pace + High Player Usage = Maximum Prop Confidence
Pace amplifies opportunity. A bottom-five DvP matchup in a sluggish, 95-possession grind yields fewer actual possessions than the same matchup in a fast-paced game with 104 possessions. More possessions mean more statistical output.
Usage rate pinpoints the primary beneficiary. If an opponent struggles to guard power forwards, you need to verify whether the opposing power forward commands a 28% usage rate or simply sits in the corner as a floor spacer. High usage ensures the player actually absorbs the offensive volume created by the weak defensive assignment.
Common Pitfalls in DvP Analysis
Even experienced analysts misinterpret positional data by falling into classic traps. Recognizing these blind spots protects your bankroll and fantasy roster.
- Ignoring Small Sample Sizes: Early in the season, a team might look like an extreme outlier against centers simply because they played the reigning MVP three times in two weeks. Always weigh sample sizes before treating a ranking as gospel.
- Failing to Track Injuries: If a defensive anchor misses a game, the team's historical DvP numbers become obsolete overnight. Rim protection collapses when a starting center sits, instantly boosting the opponent's interior scoring outlook.
- Overlooking Back-to-Back Fatigue: Teams playing on the second night of a back-to-back exhibit slower rotations and poor perimeter closeouts. This fatigue temporarily inflates DvP metrics for opposing guards and wings.
- Confusing Player Form with Matchup: A great matchup means nothing if a player is dealing with a minutes restriction, a shooting slump, or an unaddressed minor injury. Matchups amplify a player's baseline skill; they don't manufacture talent from nothing.
Reviewing official insights from the NBA Official Statistics platform helps cross-reference raw tracking data with real-time lineup changes and injury reports.
Frequently Asked Questions
How often should I check defense vs position data?
Rolling windows of 15 to 20 games provide the most reliable balance between recent form and sample size. Early-season data is often too noisy to trust without heavy adjustment.
Does DvP apply more to daily fantasy sports or prop betting?
It applies equally to both, but prop bettors use it to target specific over/under thresholds, while DFS players use it to build optimal lineups within a salary cap. In both cases, identifying hidden defensive leaks drives profitability.
Why do some teams rank poorly in DvP despite a high defensive rating?
A team can excel at team defense overall by limiting transition points and forcing tough shots, yet still struggle against specific archetypes like elite playmaking point guards or stretch bigs. DvP isolates those individual positional failures.
How do mid-season trades impact positional defense?
Trades instantly alter a team's defensive identity. Acquiring a versatile wing defender or trading away a rim-protecting center renders prior DvP data unreliable until the new rotation logs at least ten games together.


