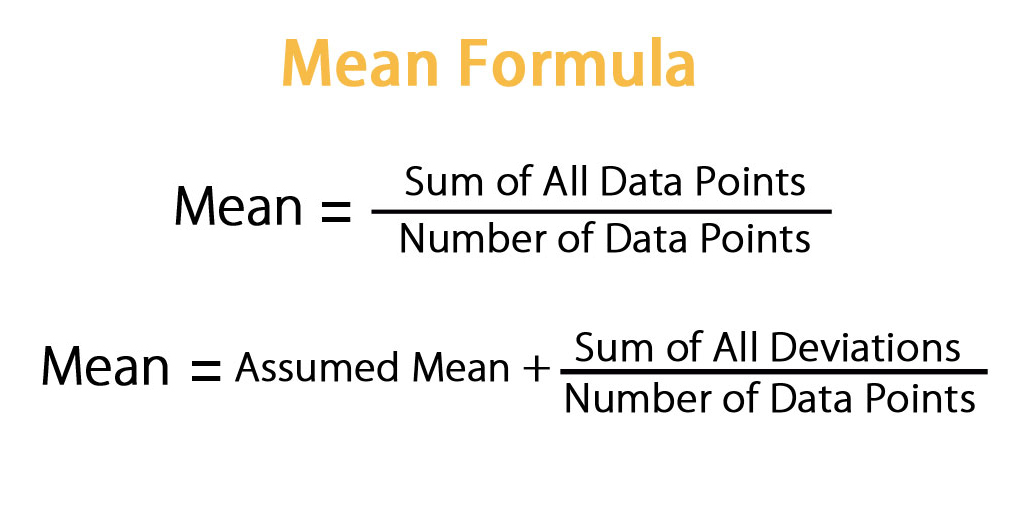
In statistics, the mean is the most common way to find the center of a data set. You add up all the individual numbers and then divide that total by how many numbers you have.
While everyday conversation often uses the word "average" interchangeably with this calculation, mathematics recognizes several types of averages, including the median and the mode. The mean specifically represents the mathematical center of gravity for a set of values, balancing out the distances of all points above and below it. Mastering this concept gives you a reliable tool for analyzing data, comparing trends, and interpreting information across everyday life, science, and business.
What Is the Mean in Math?
The arithmetic mean is a single value that summarizes a group of numbers by finding their collective balance point. Imagine you have a row of weights of varying sizes on a seesaw; the mean is the exact fulcrum point where the seesaw rests in perfect equilibrium.
To compute this value, you use a straightforward two-step process:
- Find the sum of all values in your data set.
- Divide that sum by the total count of values.
This calculation works effectively when your data follows a reasonably balanced pattern without extreme values. However, if your data set contains severe outliers—such as one exceptionally large or small number—the mean can get pulled toward that outlier, sometimes misrepresenting the true typical experience of the group.
The Standard Mean Formula
Writing the calculation in mathematical terms helps clarify how the process works for any size data set. Statisticians use standard notation to represent the arithmetic mean.
The formula is expressed as:
$$\mu = \frac{\sum x}{N}$$
For a sample rather than an entire population, the notation uses $\bar{x}$ (pronounced "x-bar") instead of $\mu$:
$$\bar{x} = \frac{\sum x}{n}$$
In these expressions:
- $\sum$ (sigma) means "the sum of."
- $x$ represents each individual value in the data set.
- $n$ or $N$ represents the total number of values.
For example, if your data set contains the numbers $4$, $8$, and $12$, you first calculate the sum ($4 + 8 + 12 = 24$). Next, you divide that sum by the count of numbers, which is $3$. The result is $8$.
Step-by-Step Calculation Guide
Working through a practical scenario makes the arithmetic mean simple to execute. Suppose a local bookstore tracks the number of poetry books sold over a five-day span. The daily sales figures are $12$, $15$, $8$, $22$, and $18$.
Here is how to calculate the mean daily sales step by step:
- List all values: Write down every data point clearly ($12, 15, 8, 22, 18$).
- Count the data points: Determine how many values you have. In this case, $n = 5$.
- Add the values together: Calculate the cumulative sum. $$12 + 15 = 27$$ $$27 + 8 = 35$$ $$35 + 22 = 57$$ $$57 + 18 = 75$$
- Divide by the count: Take your total sum ($75$) and divide it by the number of days ($5$). $$75 \div 5 = 15$$
The mean daily sales figure is $15$ books. This means that if the total sales were distributed evenly across all five days, each day would record exactly $15$ sales.
Mean vs. Median vs. Mode
People often say "average" when they actually mean mean, median, or mode. Each of these three measures belongs to a category called measures of central tendency, but they tell you different things about your data.
- The Mean: The mathematical center. It accounts for the exact numerical value of every single data point, making it sensitive to extreme highs and lows.
- The Median: The physical middle. When you arrange your data points in numerical order from least to greatest, the median is the exact center number. If there is an even number of data points, it's the mean of the two middle numbers. The median ignores the magnitude of outliers, making it ideal for skewed data like household incomes or home prices.
- The Mode: The most frequent value. It is the number that appears most often in your data set. A set can have one mode, multiple modes (bimodal or multimodal), or no mode at all if every value appears only once.
To see how they differ, look at a small set of test scores: $55$, $90$, $92$, $95$, and $98$.
- The mean is $86$ because the sum is $430$ divided by $5$.
- The median is $92$ because it sits directly in the middle of the ordered list.
- There is no mode because every score appears only once.
Notice how the single low score of $55$ pulls the mean down to $86$, even though four out of the five students scored in the nineties. The median does a better job of representing the typical student score in this specific scenario.
Real-World Applications
Understanding how to compute and interpret the mean helps you navigate professional and personal environments where data drives decisions.
In education, teachers rely on the mean to track class performance across homework assignments, quizzes, and exams. By calculating the class mean for an assessment, an instructor can quickly see whether a test was too difficult or if the concepts landed effectively with students.
In finance and budgeting, individuals and analysts use the mean to track spending habits. If you want to know your typical monthly utility bill over a year, you sum up twelve monthly statements and divide by twelve. This smoothed figure helps with cash flow planning, as explored in guidance provided by agencies like the Financial Consumer Agency of Canada.
In sports analytics, the mean rules the record books. Batting averages in baseball, points per game in basketball, and yards per carry in football all rely on calculating arithmetic means over a season or career to evaluate athlete performance objectively.
Common Mistakes to Avoid
Even though the math behind a mean is straightforward, small calculation errors happen frequently. Keep these common pitfalls in mind:
- Forgetting to count zero values: If a variable has a recorded value of zero, you must include that zero in your total count ($n$). Leaving it out artificially inflates the mean.
- Confusing weighted averages with simple means: If different data points carry different levels of importance or frequency, a simple arithmetic mean yields the wrong answer. You need a weighted mean where each value multiplies by its specific weight before dividing by the sum of the weights.
- Misinterpreting outliers: Relying solely on the mean without checking the spread or looking at the median can blind you to skewed distributions. Always check your data for extreme values before trusting the mean blindly.
For deeper technical breakdowns on statistical standards and measurement practices, you can reference resources from the National Institute of Standards and Technology.
Frequently Asked Questions
Can the mean be a decimal even if all data points are whole numbers?
Yes. The division step frequently produces a fraction or decimal, which is completely normal. For example, the mean of $2$ and $3$ is $2.5$.
What happens to the mean if you add a new data point that equals the current mean?
The overall mean stays exactly the same. Adding a value that matches the current balance point does not shift the center of gravity.
How do you find a missing value if you already know the mean?
Multiply the known mean by the total number of items to find the target sum. Then, subtract all your known individual values from that target sum to find the missing number.
Is the mean always the best measure of center?
Not always. When data sets contain extreme outliers or severe skewness—such as salaries in a corporation—the median usually provides a more accurate picture of a typical value.


