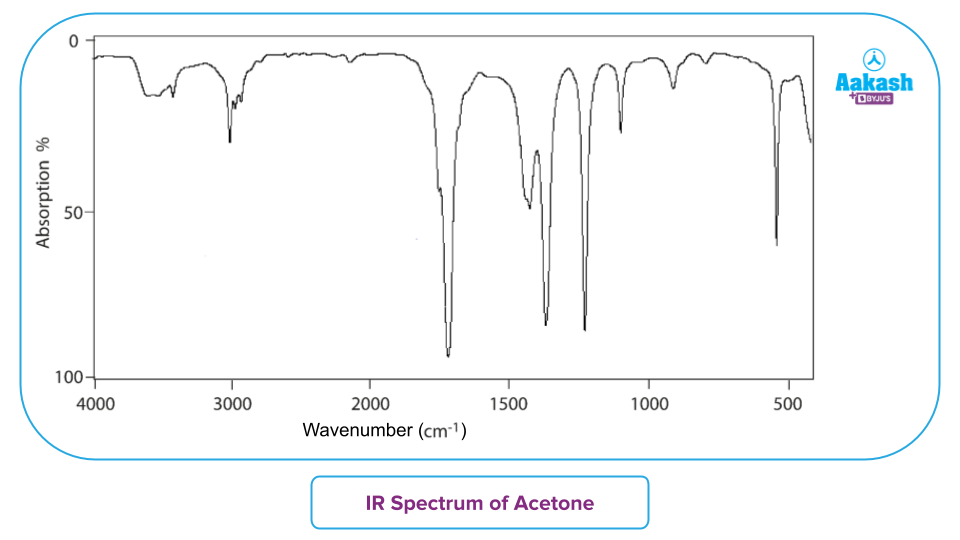
Infrared spectroscopy identifies unknown molecular structures by measuring how specific chemical bonds absorb characteristic frequencies of infrared light. When you match experimental absorption peaks against an IR spectrum table, you can pinpoint functional groups like carbonyls, alcohols, and amines without needing complex mass spectrometry.
Understanding this process requires moving past raw memorization and learning how bond strength, atomic mass, and environmental factors shift absorption frequencies. This guide breaks down how to read spectral data, navigate common regions, avoid overlapping peak confusion, and verify your structures step by step.
Anatomy of an Infrared Spectrum
An infrared spectrum plots percentage transmittance against wavenumber measured in inverse centimeters ($\text{cm}^{-1}$). Wavenumber is directly proportional to energy and frequency, meaning higher energy vibrations appear on the left side of the chart.
When infrared radiation passes through a sample, specific frequencies match the natural vibrational frequency of covalent bonds within the molecule. Those frequencies are absorbed, causing dips in the transmittance curve called peaks or bands.
Stretching Versus Bending Vibrations
- Stretching vibrations involve a continuous rhythmic movement along the bond axis, requiring higher energy and appearing at higher wavenumbers ($>1500\text{ \text{cm}}^{-1}$).
- Bending vibrations involve changes in bond angles—including scissoring, rocking, wagging, and twisting—which require less energy and dominate the fingerprint region ($<1500\text{ \text{cm}}^{-1}$).
The Hooke's Law model explains why different bonds absorb at distinct positions. Stronger bonds (like triple bonds compared to single bonds) and atoms with lower reduced mass (like hydrogen versus heavier carbon or oxygen atoms) oscillate at higher frequencies, shifting peaks to the left.
Decoding the Functional Group Region
The region above $1500\text{ \text{cm}}^{-1}$ is your primary diagnostic zone. Specific bond types consistently absorb in narrow frequency windows, making quick identification possible.
The Hydrogen Stretching Zone ($4000\text{ to }2500\text{ \text{cm}}^{-1}$)
Because hydrogen atoms are lightweight, bonds involving hydrogen vibrate at high frequencies.
- O-H and N-H stretches: Unbonded hydroxyl groups show sharp, medium peaks near $3600\text{ \text{cm}}^{-1}$. However, hydrogen bonding creates broad, intense bands. Alcohols typically center around $3300\text{ to }3400\text{ \text{cm}}^{-1}$, while carboxylic acids show an extremely broad, jagged band stretching from $2500\text{ to }3300\text{ \text{cm}}^{-1}$ that often overlaps with adjacent C-H signals.
- Primary and secondary amines: Primary amines exhibit a doublet (two peaks) between $3300\text{ and }3500\text{ \text{cm}}^{-1}$, whereas secondary amines display a single sharp peak in this same window.
- C-H stretches: Alkanes absorb just below $3000\text{ \text{cm}}^{-1}$ ($2850\text{–}2960\text{ \text{cm}}^{-1}$). If a peak appears just above $3000\text{ \text{cm}}^{-1}$, it signals unsaturated carbon-hydrogen bonds found in alkenes ($3020\text{–}3100\text{ \text{cm}}^{-1}$) or aromatic rings ($3030\text{ \text{cm}}^{-1}$).
The Triple Bond and Double Bond Zone ($2250\text{ to }1650\text{ \text{cm}}^{-1}$)
This narrower band provides definitive confirmation of multiple bonds.
- Nitriles and Alkynes: Nitriles ($\text{C}\equiv\text{N}$) produce a sharp, medium-intensity spike around $2220\text{ \text{cm}}^{-1}$. Alkynes ($\text{C}\equiv\text{C}$) absorb near $2100\text{–}2260\text{ \text{cm}}^{-1}$, though symmetrical internal alkynes may lack this peak entirely.
- Carbonyl groups ($\text{C}=\text{O}$): This is usually the most prominent peak in the entire spectrum. It appears as a sharp, intense band between $1650\text{ and }1750\text{ \text{cm}}^{-1}$. The exact environment shifts this value: ketones sit near $1715\text{ \text{cm}}^{-1}$, aldehydes show two weak C-H Fermi resonance dips near $2720\text{ and }2820\text{ \text{cm}}^{-1}$ alongside a peak at $1730\text{ \text{cm}}^{-1}$, esters appear near $1735\text{ \text{cm}}^{-1}$, and amides drop lower toward $1650\text{ \text{cm}}^{-1}$ due to resonance effects.
Navigating the Fingerprint Region
The region below $1500\text{ \text{cm}}^{-1}$ contains a dense maze of overlapping single-bond stretching and bending absorptions. While you shouldn't try to assign every individual peak here manually, this zone is vital for definitive confirmation.
No two unique chemical compounds produce identical patterns in the fingerprint region. If you compare an unknown sample's spectrum against a reference standard in the National Institute of Standards and Technology (NIST) Chemistry WebBook, an exact match in this lower region confirms identity. This zone also houses crucial carbon-oxygen single-bond stretches ($\text{C}-\text{O}$), which appear between $1000\text{ and }1300\text{ \text{cm}}^{-1}$ and help differentiate primary, secondary, and tertiary alcohols or esters.
Step-by-Step Procedure for Analyzing an Unknown Spectrum
When you face an uncharacterized organic compound, follow this systematic evaluation order to avoid misinterpreting overlapping signals.
- Scan the carbonyl region ($1800\text{–}1650\text{ \text{cm}}^{-1}$): Check if a strong, deep peak is present. If yes, you immediately know your molecule contains a carbonyl carbon, narrowing your options to aldehydes, ketones, carboxylic acids, esters, amides, acid chlorides, or anhydrides.
- Examine the far-left region ($4000\text{–}3000\text{ \text{cm}}^{-1}$): Look for broad O-H or N-H bands. If a broad band spans $3200\text{–}3600\text{ \text{cm}}^{-1}$ and you already found a carbonyl, you likely have a carboxylic acid or a hydroxyl-containing ester/amide. If there is no carbonyl but a broad peak exists, suspect an alcohol or amine.
- Check the C-H region just around $3000\text{ \text{cm}}^{-1}$: Determine whether peaks sit above or below $3000\text{ \text{cm}}^{-1}$ to classify your hydrocarbon framework as aliphatic, aromatic, or vinylic.
- Inspect intermediate zones ($2250\text{–}2100\text{ \text{cm}}^{-1}$): Rule out or confirm the presence of nitriles or triple bonds.
- Use the fingerprint region to verify: Match substitution patterns on aromatic rings or single-bond stretching networks to lock in your final structure.
Common Interpretation Pitfalls and How to Avoid Them
Even experienced analysts can misread spectra if they ignore physical sample conditions or instrument artifacts.
- Ignoring moisture contamination: Water vapor from the air or wet solvents creates a notoriously broad O-H stretch near $3400\text{ \text{cm}}^{-1}$ and a sharp bending band at $1630\text{ \text{cm}}^{-1}$. Always run a clean background scan before analyzing your sample.
- Confusing overtone bands: Carbonyl groups often produce weak overtone bands around $3400\text{ \text{cm}}^{-1}$ that can mimic dilute alcohol O-H stretches. Check peak intensity and sharpness to differentiate them.
- Overlooking sample state shifts: Running a sample as a neat liquid, in a potassium bromide ($\text{KBr}$) pellet, or via Attenuated Total Reflectance (ATR) changes how strongly hydrogen bonds form. Solid-state packing shifts peaks to slightly lower wavenumbers compared to dilute solution phases.
Frequently Asked Questions
Why do some bonds not show up on an IR spectrum?
Infrared activity requires a net change in dipole moment during vibration. Symmetrical bonds with zero dipole change—such as the $\text{C}\equiv\text{C}$ bond in a symmetrical internal alkyne or the $\text{O}=\text{O}$ bond in oxygen gas—do not absorb infrared radiation and remain invisible on the spectrum.
How do I distinguish between an aldehyde and a ketone?
Both feature a strong carbonyl peak around $1715\text{–}1730\text{ \text{cm}}^{-1}$. To tell them apart, look just to the right of the $3000\text{ \text{cm}}^{-1}$ mark for two weak, characteristic Fermi resonance helper bands at $2820\text{ and }2720\text{ \text{cm}}^{-1}$, which are generated by aldehyde C-H stretching. Ketones lack these two specific dips.
What causes peak broadening in infrared spectra?
Hydrogen bonding is the primary driver of peak broadening. When molecules form intermolecular or intramolecular hydrogen bonds, the bond strength varies across individual molecules in the sample matrix, creating a distribution of vibrational frequencies that smear the absorption band across a wider wavenumber range.
Can infrared spectroscopy determine molecular weight?
No. Infrared spectroscopy identifies functional groups and structural connectivity, but it does not provide molecular mass or formula weight. You must pair IR data with mass spectrometry or elemental analysis to determine the complete molecular formula.


