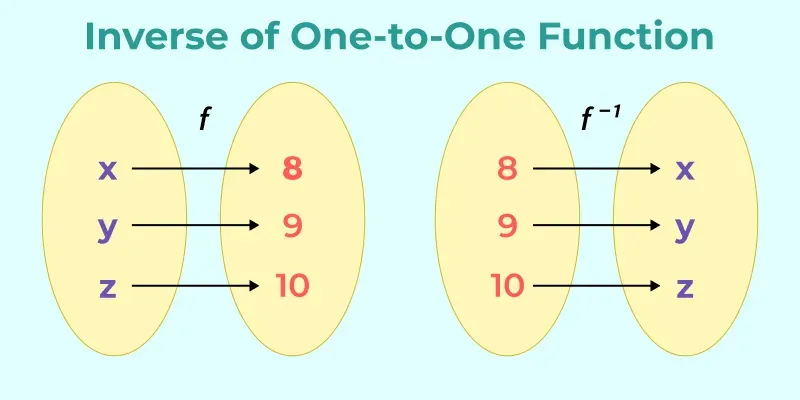
An inverse relationship occurs when two variables move in opposite directions: as one variable increases, the other decreases. When graphing this dynamic, the resulting curve slopes downward from left to right, reflecting an indirect association between the two quantities. Understanding how these opposite movements function is essential across economics, physics, finance, and everyday decision-making.
In mathematical terms, an inverse relationship can be modeled by the equation $y = \frac{k}{x}$ or $xy = k$, where $k$ represents a constant non-zero value. If you double the value of $x$, the value of $y$ drops by half to keep their product constant. This contrasts sharply with a direct relationship, where variables move together in the same direction at a proportional rate.
Defining Characteristics of Inverse Relationships
To recognize an inverse relationship accurately, you need to understand its distinct mathematical and visual behaviors. It's not enough for two data points to simply move in opposite directions on a single day; the relationship must follow a predictable, rule-bound structure.
- Negative Slope: On a Cartesian coordinate plane, plotting an inverse relationship yields a downward-sloping line or a hyperbola. As the horizontal axis ($x$) increases, the vertical axis ($y$) drops toward zero without ever touching it.
- Constant Product: For inverse proportionality, multiplying the two variables always yields the same constant ($k$). If $x = 2$ and $y = 10$, then $k = 20$. If $x$ rises to $4$, $y$ must fall to $5$ so the product stays at $20$.
- Asymptotic Behavior: As one variable approaches infinity, the other approaches zero, creating asymptotes on a graph where the variables never quite reach absolute zero.
Real-World Examples Across Disciplines
Inverse relationships appear constantly in practical scenarios. Recognizing these patterns helps analysts interpret data and make better projections.
Economics and Market Demand
The most common economic application is the law of demand. In standard market conditions, price and quantity demanded maintain an inverse relationship. When a retailer raises the price of a product, consumer demand drops because buyers seek alternatives or reduce consumption. Conversely, lowering the price stimulates higher purchase volume.
Another classic financial example involves bond prices and yields. When prevailing interest rates rise, existing bonds with lower fixed coupon payments become less attractive, causing their market prices to fall. When interest rates drop, older bond prices rise.
Physics and Physical Sciences
Physics relies heavily on inverse relationships to explain physical laws. A clear instance is the connection between speed and travel time over a fixed distance. If you drive a distance of 100 miles at 50 miles per hour, the trip takes 2 hours. If you double your speed to 100 miles per hour, travel time drops to 1 hour. The formula $Time = \frac{Distance}{Speed}$ demonstrates this inverse proportion directly.
Boyle's law in thermodynamics offers another physical example. It states that the absolute pressure exerted by a given mass of an ideal gas is inversely proportional to the volume it occupies, provided the temperature remains constant. If you compress a gas to half its original volume, its pressure doubles.
Inverse Relationship vs. Negative Correlation
A frequent mistake is treating inverse relationships and negative correlations as identical concepts. While both describe variables moving in opposite directions, they differ in predictability and mechanism.
An inverse relationship typically implies a deterministic or exact mathematical rule where one variable dictates the exact change in another based on a formula.
A negative correlation is a statistical measure used in data analysis to describe a tendency. It tells us that two variables tend to move in opposite directions across a dataset, but it doesn't guarantee a strict formulaic ratio. For instance, winter coat sales and outdoor temperatures show a strong negative correlation, but you can't calculate exact coat sales using a rigid mathematical constant based solely on the temperature.
Common Pitfalls When Analyzing Opposite Variables
When working with variables that move in opposite directions, analysts often run into specific errors that distort their conclusions.
- Assuming Causation from Correlation: Just because two variables move in opposite directions doesn't mean one causes the other. An unobserved third factor might drive both movements simultaneously.
- Ignoring Non-Linearity: Many analysts try to fit a straight line to data that actually follows an inverse curve. This misapplication leads to severe forecasting errors at the extremes of the dataset.
- Overlooking Outliers: A single extreme data point can heavily skew a negative correlation coefficient, making an inverse relationship appear much stronger or weaker than it actually is in reality.
Frequently Asked Questions
What is the mathematical formula for an inverse relationship?
The standard equation is $y = \frac{k}{x}$, where $k$ is a constant. This can also be written as $xy = k$, meaning the product of the two variables always equals the same number.
How do you spot an inverse relationship on a graph?
Look for a curve or line that slopes downward from left to right. As you move from left to right along the horizontal axis, the data points drop lower on the vertical axis.
Is an inverse relationship always proportional?
No. While inverse proportionality is a specific mathematical type where the product remains constant, general inverse relationships simply describe any scenario where one variable increases while the other decreases, regardless of whether the rate of change is linear or non-linear.
How is this used in financial portfolio management?
Investors often seek assets with negative correlations—such as stocks and certain government bonds—to diversify portfolios. When stocks drop during a market downturn, safer assets often rise, helping cushion overall portfolio volatility.



