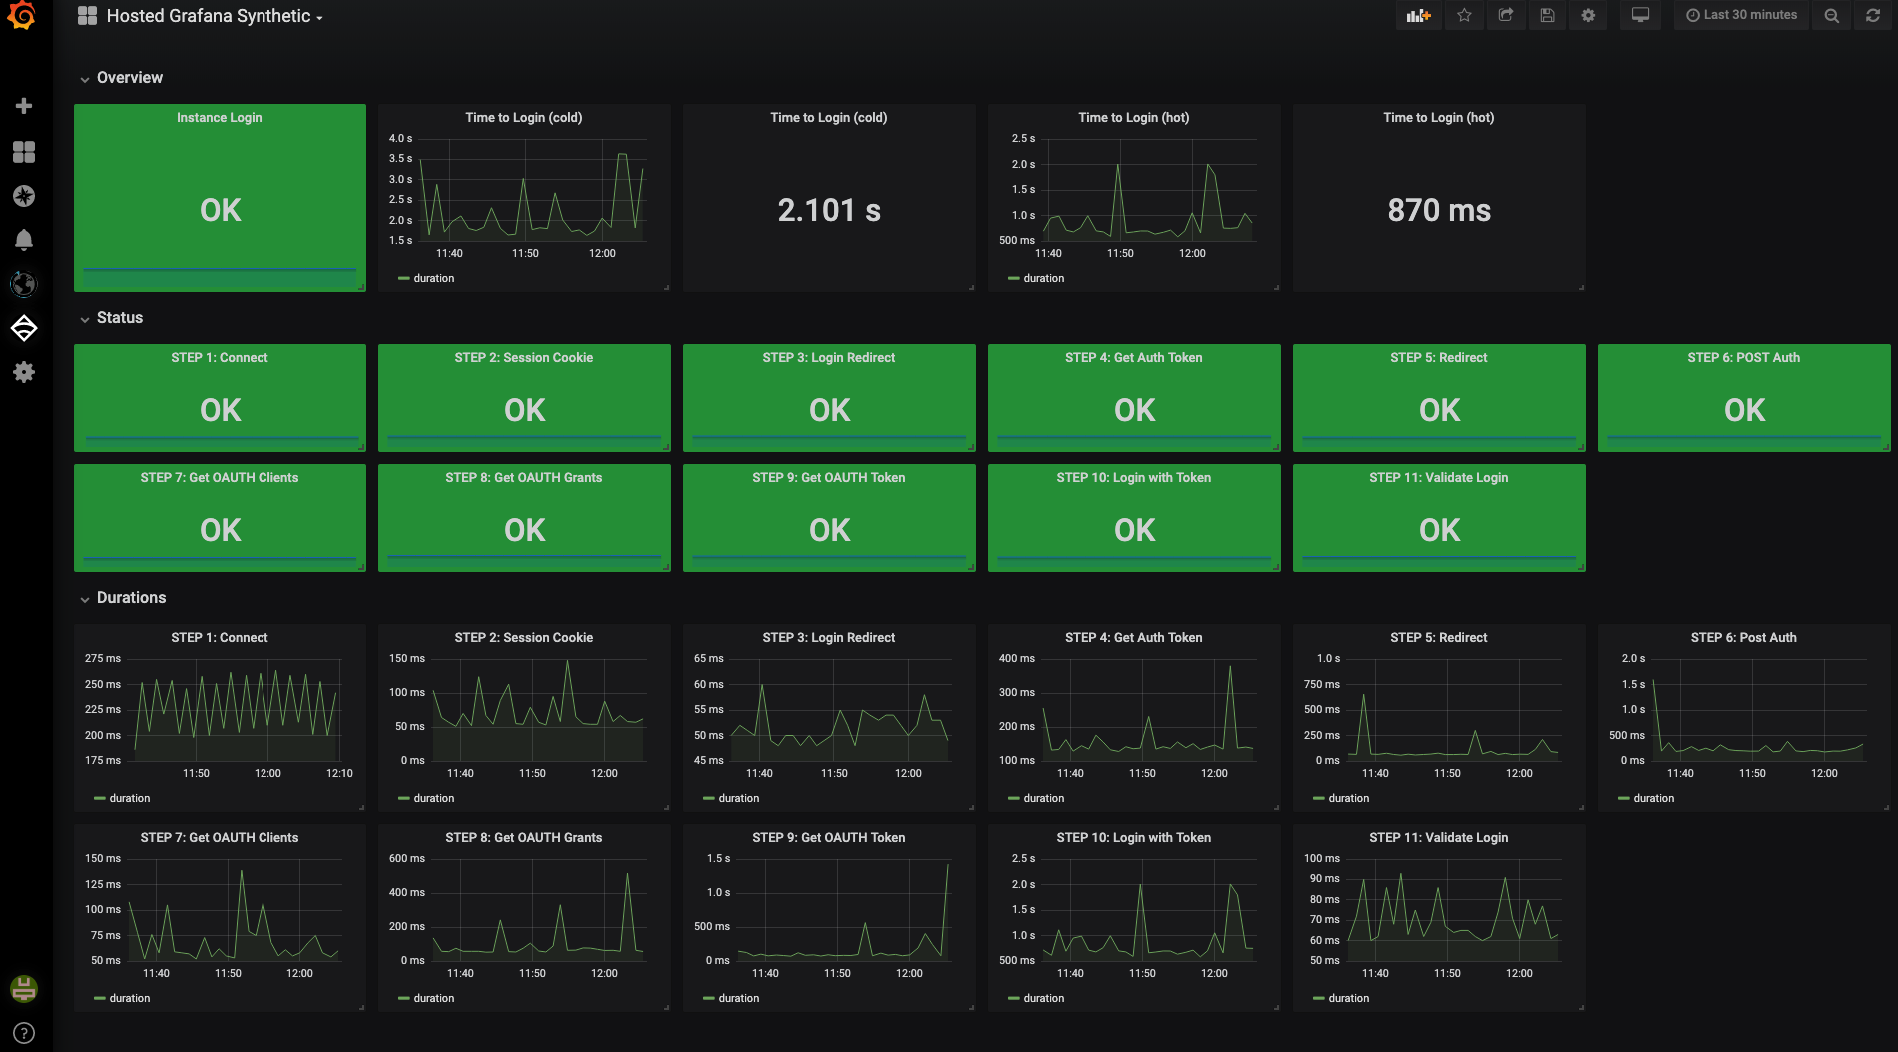
Visualizing custom data shouldn't require complex UI workarounds. If you already collect metrics using Python scripts, connecting them straight to Grafana gives you real-time visibility without building custom web frontends from scratch.
Many tutorials rely on outdated client libraries or pseudo-code that fails in production. This guide walks through setting up concrete connections, pushing time-series metrics via APIs, structuring JSON dashboards programmatically, and avoiding common authentication and payload errors.
Understanding the Integration Architecture
Grafana doesn't natively parse arbitrary Python data structures out of the box. Instead, you bridge Python and Grafana using one of two primary patterns: pushing data to an HTTP-compatible backend data source (like Prometheus, InfluxDB, or Loki) that Grafana queries, or writing custom JSON dashboard models via the HTTP API for automated provisioning.
Pushing metrics directly via an intermediary time-series database is the industry standard. Python handles the extraction and transformation, while Grafana renders the panels.
Choosing the Right Storage Backend
Before writing any Python code, you need a data destination that Grafana recognizes.
- Prometheus: Best for numerical metrics scraped at regular intervals. Python exposes metrics using client libraries.
- InfluxDB: Ideal for high-frequency writes and custom time-series events pushed directly from scripts.
- SQLite / PostgreSQL: Useful for tabular reports rendered via SQL data sources in Grafana.
For most scripts, InfluxDB offers the simplest direct-write API from Python.
Pushing Metrics from Python to InfluxDB
To visualize Python data in Grafana, you first write the data points to a database. Here is how you send CPU and memory stats using the official InfluxDB client in Python.
First, install the required package in your terminal:
pip install influxdb-client
Next, write a script that pushes periodic readings:
import time
import psutil
from influxdb_client import InfluxDBClient, Point, WritePrecision
from influxdb_client.client.write_api import SYNCHRONOUS

token = "your-super-secret-auth-token"
org = "my-org"
bucket = "system-metrics"
url = "http://localhost:8086"

client = InfluxDBClient(url=url, token=token, org=org)
write_api = client.write_api(write_options=SYNCHRONOUS)

try:
    while True:
        cpu_load = psutil.cpu_percent(interval=1)
        mem_usage = psutil.virtual_memory().percent

        point = (
            Point("server_stats")
            .tag("host", "local_machine")
            .field("cpu_percent", cpu_load)
            .field("memory_percent", mem_usage)
        )

        write_api.write(bucket=bucket, org=org, record=point)
        print(f"Sent: CPU {cpu_load}%, MEM {mem_usage}%")
        time.sleep(5)
except KeyboardInterrupt:
    client.close()
    print("Stopped metric collection.")
Once this script runs, your database receives continuous points, ready for Grafana to query.
Querying and Visualizing in Grafana
With your data flowing into InfluxDB, configure Grafana to display it:
- Open your Grafana instance in a web browser and log in with admin credentials.
- Navigate to Connections > Data sources and click Add data source.
- Select InfluxDB, choose the Flux or InfluxQL query language matching your database setup, and input your connection URL (
http://localhost:8086) along with your token and organization name. - Click Save & test to verify connection health.
- Create a new dashboard, click Add visualization, and select your InfluxDB data source.
- Write a query to fetch your fields, such as measuring
cpu_percentover time.
Grafana will instantly render a time-series graph updating live as your Python script pushes new metrics.
Automating Dashboard Provisioning with Python
If you manage multiple environments, creating dashboards manually in the UI slows down deployments. You can use Python and the Grafana HTTP API to programmatically create and update entire dashboards.
Here is how you authenticate and push a dashboard layout using the requests library:
import json
import requests

grafana_url = "http://localhost:3000/api/dashboards/db"
api_key = "your_grafana_service_account_token"

headers = {
    "Authorization": f"Bearer {api_key}",
    "Content-Type": "application/json"
}

dashboard_payload = {
    "dashboard": {
        "id": None,
        "title": "Automated Python Metrics",
        "timezone": "browser",
        "panels": [
            {
                "id": 1,
                "title": "CPU Load",
                "type": "timeseries",
                "gridPos": {"h": 8, "w": 12, "x": 0, "y": 0},
                "targets": [
                    {
                        "query": "from(bucket: \"system-metrics\") |> range(start: v.timeRangeStart) |> filter(fn: (r) => r[\"_measurement\"] == \"server_stats\") |> filter(fn: (r) => r[\"_field\"] == \"cpu_percent\")",
                        "refId": "A"
                    }
                ]
            }
        ],
        "version": 0
    },
    "overwrite": True
}

response = requests.post(grafana_url, headers=headers, data=json.dumps(dashboard_payload))

if response.status_code == 200:
    print("Dashboard created successfully:", response.json().get("url"))
else:
    print("Failed to create dashboard:", response.status_code, response.text)
This script sends a structured JSON payload directly to Grafana's backend, generating a fully configured panel without requiring manual UI configuration.
Common Pitfalls and Troubleshooting
When integrating Python scripts with monitoring platforms, developers frequently run into distinct roadblocks.
- Authentication Failures: Using legacy API keys instead of modern Service Account tokens causes 401 unauthorized errors in newer Grafana versions. Always generate tokens via Administration > Service accounts.
- Timestamp Mismatches: If your Python script sends UTC timestamps that drift from your server clock by more than a few minutes, InfluxDB or Prometheus may drop the points entirely. Use
time.time()or ensure NTP synchronization is active. - High Cardinality Tags: Tagging your database points with unique identifiers like random user IDs or full file paths creates millions of time series, causing memory bloat in your storage backend. Keep tag values bounded and put high-cardinality data into fields.
Frequently Asked Questions
Can I run Grafana queries directly inside a Python script?
Yes. You can use the InfluxDB client query API or query Prometheus via its HTTP API (/api/v1/query) directly in Python to pull aggregated metric data into data science notebooks or automated alert scripts.
Is it possible to embed Grafana panels into a custom Python web app?
Yes. You can use Grafana's public dashboard feature or generate iframe URLs with anonymous access enabled, though you must configure security settings carefully to prevent unauthorized data exposure.
What Python library handles enterprise Grafana administration best?
While community wrappers exist, calling the official Grafana HTTP REST API directly using standard Python libraries like requests provides the most stable, version-agnostic control over user permissions, folders, and dashboard provisioning.



