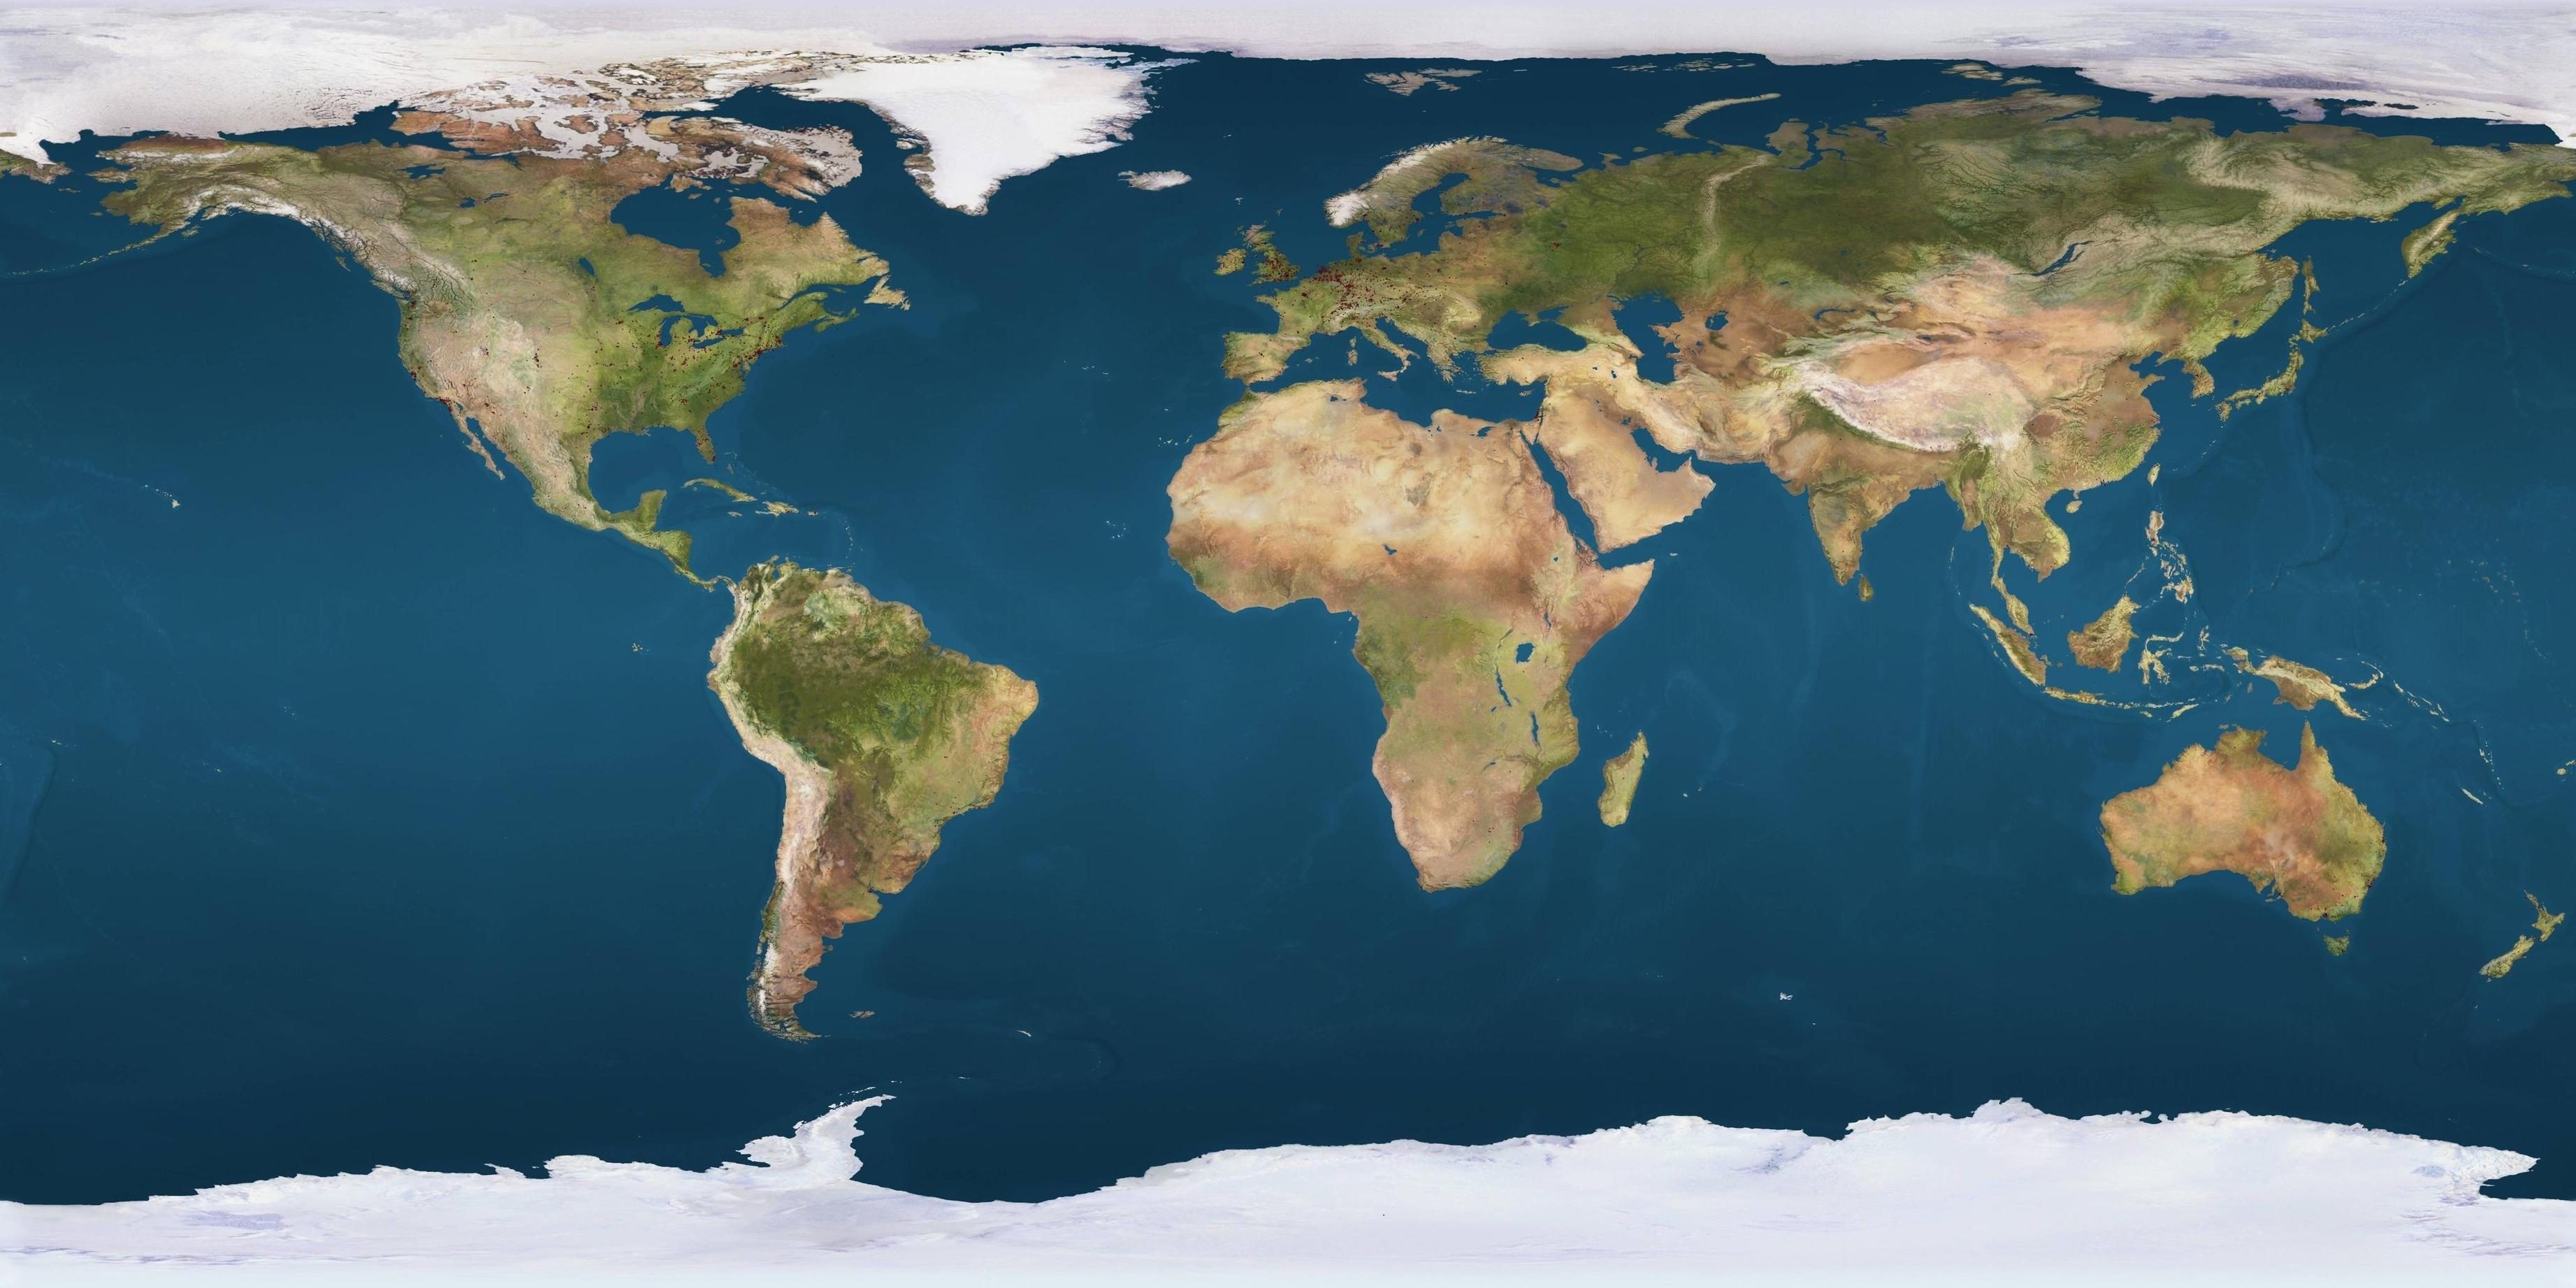
Determining the exact global white population percentage is complex because major international organizations like the United Nations don't track human populations by race or ethnicity. Varying national legal definitions, shifting census categories, and historical differences in racial classification make precise counting impossible. Broad demographic assessments indicate that people of European descent or those classified as white make up roughly 7 to 15 percent of the global population, spanning roughly 500 million to 1.2 billion people out of a total planetary count exceeding 8 billion.
This article explores how demographers approach global ethnic breakdowns, why official numbers remain elusive, and what regional trends reveal about the changing distribution of human populations.
Defining "White" on a Global Scale
The term white lacks a universal scientific or legal definition. What counts as white in one country might fall under a completely different category in another.
For instance, the U.S. Census Bureau historically includes individuals having origins in any of the original peoples of Europe, the Middle East, or North Africa under the white category. Meanwhile, other nations restrict the classification strictly to people of European ancestry. In Latin America, concepts of race often blend ancestry, skin tone, and social standing, resulting in categories like mestizo or self-identifications that don't neatly map onto North American or European racial boxes.
Because these definitions shift across borders, aggregating a single worldwide percentage requires broad generalizations. When researchers estimate that white people comprise roughly 10 percent of the earth's inhabitants, they are usually combining populations from Europe, North America, Australia, New Zealand, and parts of the Southern Cone of South America, while excluding overlapping populations in the Middle East and North Africa.
Why Global Institutions Avoid Racial Statistics
Major demographic bodies, including the World Bank and the United Nations, focus their data collection on metrics like age, sex, fertility rates, migration, and economic status rather than race. There are several reasons for this omission:
- Lack of Standardized Categories: A census question asked in France differs fundamentally from one asked in South Africa or Brazil, making cross-country comparisons statistically invalid.
- Legal and Political Restrictions: Many countries legally prohibit the collection of ethnic or racial data on government censuses to prevent discrimination or protect privacy rights.
- Fluidity of Identity: Ethnic and racial identities change over generations through intermarriage, cultural assimilation, and shifting social norms.
As a result, any global percentage you encounter for any major racial group is an educated estimate derived from regional censuses, migration records, and anthropological studies rather than a direct global headcount.
Regional Distribution of European Descent
To understand where white populations live today, it helps to break down the numbers by continent and major region.
Europe
Europe remains the historic heartland of populations of European descent, though its share of the global total is shrinking. With a total continental population of roughly 740 million, Europe's growth rates are currently flat or negative, and its median age is the highest of any major world region. Countries like Italy, Spain, and Germany face declining birth rates well below the replacement level of 2.1 children per woman.
North America
In the United States and Canada, populations of European descent have historically formed the demographic majority, though that proportion is shifting. According to census bureau projections, immigration patterns and higher birth rates among non-white communities mean that the non-Hispanic white population in the United States has experienced a gradual proportional decline over recent decades.
Oceania
Australia and New Zealand feature large populations of European descent, stemming from centuries of British and European migration. However, both nations have increasingly diverse populations driven by high rates of immigration from Asia and the Pacific Islands.
Historical Shifts in World Population Shares
Global demographic weight has shifted dramatically over the last two centuries. During the peak of the Industrial Revolution in the 19th and early 20th centuries, rapid modernization and demographic transitions in Europe caused its share of the world population to peak at roughly 25 percent.
Since the mid-20th century, that dynamic has inverted. Sub-Saharan Africa, South Asia, and parts of Southeast Asia have experienced massive population growth due to declining infant mortality rates and younger median ages, while European populations aged and stabilized. Today, Asia accounts for over half of the global population, with India and China alone representing massive shares of humanity, pushing European-descended populations down to a much smaller percentage of the global total.
Frequently Asked Questions
What is the largest ethnic group in the world?
Han Chinese is widely recognized as the largest single distinct ethnic group on earth, accounting for roughly 19 percent of the global population. Broad regional groupings, such as South Asians, also make up a massive share—roughly 30 percent of humanity.
Is the global white population declining in absolute numbers?
While some individual countries with majority-white populations are experiencing natural population decline (where deaths outnumber births), the global total remains relatively stable depending on how the demographic category is defined and measured.
Why do estimates for global racial percentages vary so wildly?
Estimates range from 6 to 15 percent because different researchers include or exclude populations from regions like the Middle East, Latin America, and North Africa. Without a uniform global standard, these numbers are interpretive approximations.
Do birth rates affect global demographic shares?
Yes. Fertility rates are the primary driver of shifts in global population shares. Regions with higher fertility rates, particularly in parts of sub-Saharan Africa, are growing much faster than regions with low fertility rates, such as Europe and East Asia.