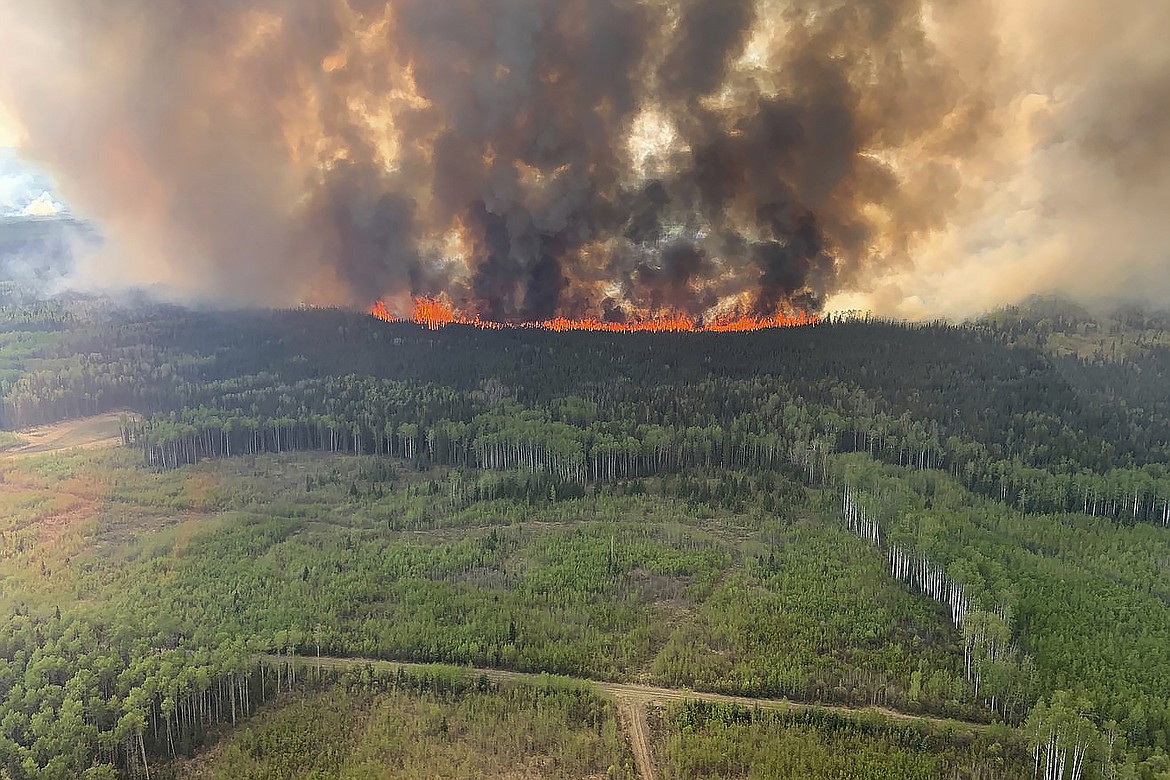
When a wildfire races toward a mountain community or a river overflows its banks, emergency coordinators don't have time to unfold paper maps. Every minute wasted costs lives. Geographic data visualization turns raw satellite feeds and sensor streams into actionable blueprints for survival, changing how agencies prepare for and react to sudden-onset disasters.
Disaster mapping combines geographic information systems, remote sensing, and crowd-sourced data to visualize hazards, model impact zones, and direct relief efforts in real time. Unlike static maps drawn after an event, modern operational maps update continuously as conditions shift on the ground. They track flood boundaries, pinpoint trapped residents, and guide heavy rescue equipment away from blocked routes.
The Core Components of Modern Emergency Mapping
Building an effective operational map requires integrating multiple data streams before, during, and after an event. Relying on a single source of information leaves blind spots that can compromise rescue operations.
Baseline Geographic Data
Before any disaster strikes, agencies need comprehensive baseline data. This includes high-resolution elevation models, infrastructure inventories, and historical hazard records.
- Digital Elevation Models (DEMs): Essential for predicting flood paths and landslide runout zones based on terrain slope and contour lines.
- Critical Infrastructure Layers: Precise coordinates for hospitals, fire stations, power substations, and water treatment plants.
- Cadastral Data: Property boundaries and parcel numbers that help responders identify population concentrations and structural density.
Real-Time Sensor and Satellite Feeds
When an event unfolds, static data isn't enough. Responders plug live feeds into their mapping dashboards to track the crisis as it happens.
- Synthetic Aperture Radar (SAR): Satellites that peer through thick clouds and smoke to map flood extents or burn scars day or night.
- IoT Stream Gauges: Automated sensors in rivers that trigger instant flood warnings and update inundation polygons downstream.
- Weather Radar Integrations: Live Doppler feeds that show precipitation intensity, wind vectors, and storm cell trajectories.
How Emergency Teams Use Spatial Data on the Ground
Having data in a central office doesn't help crews in the field unless it's translated into tactical actions. Incident commanders rely on spatial dashboards to solve immediate operational problems.
When evacuation orders drop, routing algorithms analyze blocked bridges, gridlocked traffic corridors, and rising water levels to plot safe exit routes for residents. Instead of sending people down roads that are already cut off, dispatchers update digital maps instantly, routing vehicles away from danger.
Search and rescue teams use mobile GIS applications on rugged tablets to mark checked homes, locate distress signals from mobile phones, and assign grids to specific crews. This eliminates duplicate searches and ensures no neighborhood is overlooked.
Once the immediate threat passes, assessment teams document structural damage using geotagged photos and forms. Insurance adjusters, municipal planners, and federal disaster agencies use these damage layers to calculate losses, prioritize debris removal, and disburse relief funds accurately.
Key Technologies Driving Spatial Crisis Response
The capability of disaster mapping has transformed over the past decade thanks to several core technologies working in tandem.
Geographic Information Systems serve as the foundational software engine. Platforms like Esri ArcGIS allow organizations to ingest disparate data layers, analyze spatial relationships, and publish web maps that field personnel can view on phones or laptops.
Unmanned aerial vehicles, or drones, fill the gap between high-altitude satellites and street-level views. When a bridge collapses or a tornado flattens a neighborhood, a drone can launch within minutes, capturing centimeter-resolution orthomosaics that reveal exact structural damage without risking pilot safety.
Artificial intelligence now automates the heavy lifting of image analysis. Machine learning models train on millions of pre- and post-disaster satellite images, instantly detecting collapsed roofs, flooded roadways, or new landslide deposits in minutes rather than days.
Common Pitfalls in Crisis Mapping Implementation
Even with advanced software, emergency mapping efforts often fail due to predictable operational mistakes.
- Data Silos: Different municipal departments often maintain separate mapping databases that don't talk to each other. Police, fire, and public works must share standardized layers before an emergency occurs.
- Bandwidth Bottlenecks: Cell towers often fail during major disasters. Relying solely on cloud-hosted maps without offline caching leaves field workers staring at blank screens when connectivity drops.
- Information Overload: Flooding operators with unverified social media reports clogs decision-making channels. Every incoming data point needs automated or manual verification before it goes onto an operational map.
- Ignoring Local Knowledge: Algorithms miss nuance. Failing to consult local residents and indigenous communities who know where water pools during unusual storms leads to flawed hazard models.
Building Community Resilience Through Mitigation Mapping
Disaster mapping isn't just an emergency response tool; it's a vital component of long-term planning and zoning. Communities use historical hazard modeling to draft building codes, establish setback lines along rivers, and design retention basins that absorb excess runoff before it hits residential areas.
By overlaying demographic data with hazard zones, cities can identify vulnerable populations—such as elderly residents or neighborhoods with low vehicle ownership—and pre-position resources or design targeted evacuation assistance programs long before a storm makes landfall.
Frequently Asked Questions
What is the difference between static maps and operational disaster maps?
Static maps show fixed geographic features like topography or political boundaries and cannot change during an event. Operational disaster maps are dynamic dashboards that ingest real-time data feeds, weather updates, and field reports to track an unfolding crisis as it happens.
How do drones improve disaster response compared to satellites?
Satellites offer broad regional coverage but can be blocked by heavy clouds or smoke, and they may pass over a specific location only once a day. Drones fly below cloud cover, providing immediate, high-resolution imagery of specific neighborhoods or damaged infrastructure on demand.
Can emergency maps work without an internet connection?
Yes. Field personnel use offline GIS applications that download map tiles and data layers to local device storage beforehand. This allows rescue workers to navigate and log data even when cellular networks and power grids fail entirely.
How does machine learning speed up damage assessment?
Machine learning algorithms analyze satellite and aerial imagery by comparing pre-disaster photos with post-disaster captures. The software flags altered pixels, identifying destroyed buildings or flooded streets in minutes, allowing human analysts to verify priority areas quickly.