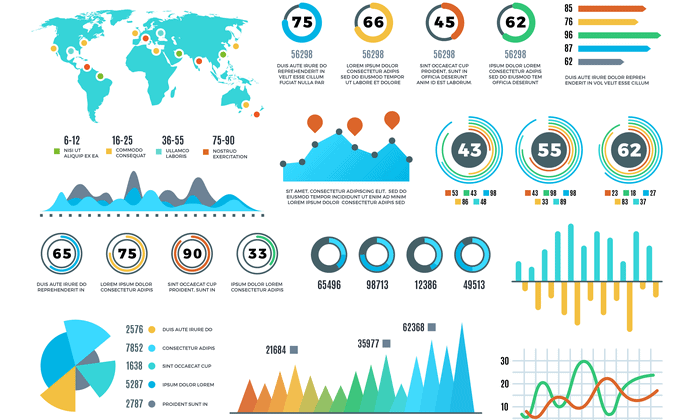
Data visualization transforms raw statistics into narrative arcs that decision-makers can instantly grasp. When you pair hard numbers with clear visual design, you remove ambiguity and drive action across teams. Without a visual structure, spreadsheets remain silent rows of figures that fail to communicate urgency or opportunity.
Effective visual storytelling requires understanding how the human brain processes visual elements faster than text. By translating metrics into charts, graphs, and structured dashboards, you create a shared mental model for your audience. This guide breaks down how to build compelling visual narratives, select the right chart types for specific datasets, and avoid common design traps that distort information.
The Cognitive Mechanics of Visual Data
Your audience scans metrics through pattern recognition rather than line-by-line reading. The human visual system processes shapes, colors, and spatial positions in milliseconds, whereas reading numeric tables requires sequential cognitive effort.
When you design a chart, you assign data variables to visual properties like length, position, and hue. Position and length offer the highest accuracy for human perception, while color intensity and 3D volumes introduce perceptual errors. Selecting the right visual encoding ensures your viewers interpret proportions and trends accurately without second-guessing the scale.
Working memory also limits how much raw data stakeholders can hold at once. Visualizing trends reduces cognitive load by grouping related data points into unified shapes. A well-constructed trend line communicates growth or decline instantly, freeing your audience to focus on strategy rather than arithmetic.
Identifying Your Core Message and Audience
Every effective data story starts with a single, compelling thesis. Before opening a design tool, define what action your audience needs to take after viewing the visualization.
- Determine the primary takeaway: Distill your dataset down to one central finding. If your audience remembers only a single chart, what must it show?
- Analyze audience expertise: Tailor the depth of your visual narrative to the technical literacy of your stakeholders. Executives need high-level summaries and clear variance metrics, while data analysts require granular breakdowns and confidence intervals.
- Establish context: Numbers lack meaning in isolation. Always anchor your data against a baseline, such as historical performance, industry benchmarks, or stated targets.
Focusing on the end goal prevents clutter. If a data point does not support your core thesis, remove it from the primary view to keep the narrative sharp and direct.
Selecting the Right Visual Format
Choosing an inappropriate chart type destroys credibility and confuses stakeholders. Match your data structure directly to the correct visual container.
- Comparison: Use horizontal bar charts to compare discrete categories, especially when category labels are long. Vertical column charts work well for time-series comparisons with fewer than ten data points.
- Composition: Use stacked bar charts or tree maps to show part-to-whole relationships. Avoid traditional pie charts when comparing more than five slices, as human eyes struggle to judge angular differences accurately.
- Distribution: Use histograms or box plots to display how data points spread across a range, revealing clusters, skews, and outliers.
- Relationship: Use scatter plots to examine correlations between two continuous variables, highlighting potential cause-and-effect patterns.
For deeper standards on visual perception and graphical integrity, reference the guidelines established by organizations like FlowingData and academic research on visual communication.
Designing Dashboards for Clarity
Dashboards often fail because creators pack them with too many metrics, turning a useful tool into a confusing wall of indicators. A clean dashboard guides the eye naturally from high-level summaries down to granular details.
Place your most critical Key Performance Indicators at the top left, matching natural reading patterns in Western languages. Use consistent color palettes where a single accent color highlights anomalies or targets met, while neutral tones handle background gridlines and secondary data.
Avoid decorative elements that do not convey data. Chart junk, unnecessary gridlines, and heavy drop shadows distract from the numbers and slow down comprehension. White space is a functional design element that separates distinct metrics and gives the human eye room to rest.
Common Pitfalls in Data Storytelling
Even accurate data can mislead audiences if visual scaling and presentation rules are ignored. Watch out for these frequent mistakes when building your visuals:
- Truncated axes: Starting a bar chart axis above zero exaggerates small differences, making minor fluctuations look like massive swings. Always start quantitative axes at zero unless dealing with continuous temperature scales or financial indices where zero is arbitrary.
- Overloading dimensions: Adding secondary y-axes and dual encodings into a single line chart creates visual clutter that viewers cannot parse. Split complex relationships into separate, coordinated small multiples instead.
- Misusing color: Relying on rainbow color palettes creates artificial boundaries in continuous data and alienates users with color vision deficiencies. Use sequential or diverging single-hue palettes for quantitative measures.
For more information on ethical data presentation and statistical literacy, explore educational resources provided by FlowingData and open data initiatives.
Frequently Asked Questions
How do I choose between a table and a chart?
Use tables when your audience needs to look up exact values or compare individual data points across multiple precise dimensions. Use charts when you want to communicate overall trends, patterns, outliers, and rapid comparisons at a glance.
What is the biggest mistake beginners make in data design?
Overdesigning. Beginners often add unnecessary gradients, 3D effects, and excessive color variations that obscure the underlying numbers rather than illuminating them. Simplicity always wins in data communication.
How many metrics should appear on a single dashboard?
Limit your primary dashboard view to five or six key metrics. If stakeholders need deeper context, provide drill-down capabilities or secondary tabs rather than crowding the main interface.
Can storytelling apply to automated reporting?
Yes. Automated dashboards can incorporate narrative text blocks, conditional formatting, and threshold alerts that highlight significant variance automatically, guiding users straight to the anomalies that require attention.



