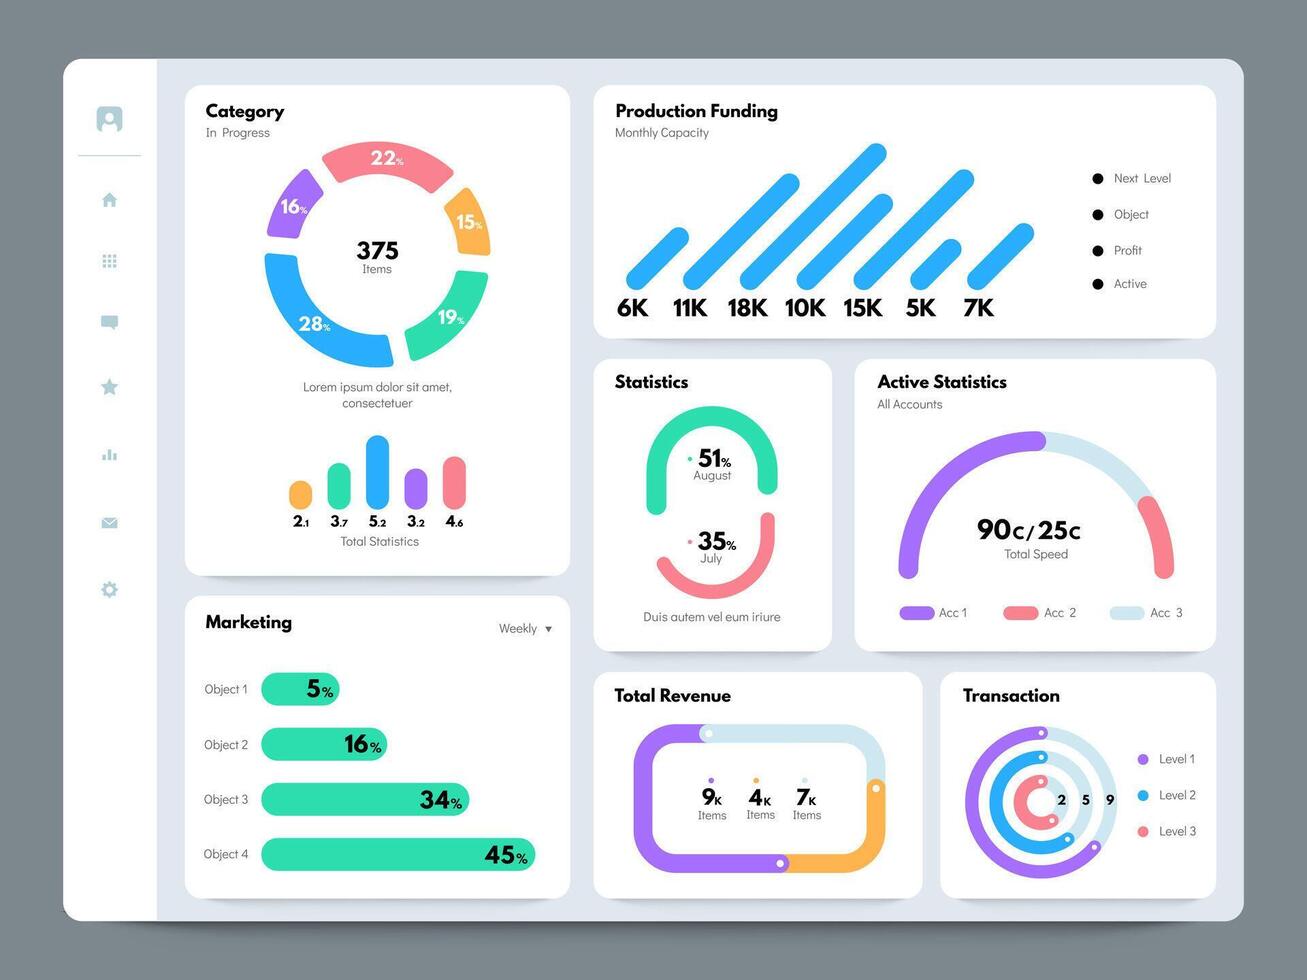
When you're staring at spreadsheets filled with thousands of rows, finding a clear path forward feels impossible. Operational clarity doesn't come from hoarding raw figures; it comes from transforming those numbers into focused visual control panels. Teams that ground their choices in structured metrics move faster and make fewer costly errors.
Data-driven decision making relies on turning complex information streams into immediate, readable insights. Without a centralized interface, organizations drown in conflicting reports, slow down operations, and rely on guesswork. High-impact visual panels solve this friction by displaying key performance indicators in real time, letting teams spot trends, isolate anomalies, and execute corrective actions before minor issues compound.
Moving Beyond Static Reports
Traditional reporting looks backward. Monthly PDFs and static spreadsheets show what happened weeks ago, but they don't help you adjust course today. Modern visualization tools shift the focus from historical archiving to active operational management.
When you build a dynamic control interface, you establish a single source of truth across departments. Marketing, finance, and operations stop arguing about whose numbers are correct. Instead, they look at synchronized metrics that update automatically.
- Real-time visibility: Track performance metrics as they happen rather than waiting for end-of-month summaries.
- Contextual alignment: Connect individual team outputs directly to broader company goals.
- Reduced cognitive load: Filter out vanity metrics to focus strictly on actionable signals.
According to a National Institute of Standards and Technology study on organizational efficiency, structured data processing significantly cuts down administrative response times. If your team spends hours compiling numbers instead of acting on them, your reporting setup needs an overhaul.
Core Principles of Effective Metric Layouts
Throwing every available chart onto a single screen creates visual noise. An effective control panel requires strict curation. Every widget on your display must tie directly to a specific business question or operational choice.
When designing your layout, keep the most critical indicators at the top left, matching natural reading patterns. Group related metrics together—keep financial health indicators separate from customer acquisition funnels, but accessible via clear sub-sections. Assign clear ownership to every metric so everyone knows who is responsible if a threshold dips into the red zone.
- Define strategic goals: Identify the three primary objectives your team must achieve this quarter.
- Select leading indicators: Choose metrics that predict future performance rather than just recording past results.
- Establish review cadences: Set daily, weekly, or monthly check-ins depending on how fast the underlying process moves.
- Document thresholds: Outline the exact operational trigger that forces a change in strategy.
Common Design Pitfalls to Avoid
Many companies invest heavily in analytics software only to watch adoption stall because the interface fails basic usability tests. Avoiding common mistakes ensures your team actually uses the tools you build.
- Cluttering the interface: Cramming fifty different charts onto one screen overwhelms users and hides critical trends.
- Ignoring data hygiene: Feeding inaccurate or siloed datasets into your visualizer leads to confident miscalculations.
- Failing to assign owners: If nobody is accountable for a specific metric, performance against that metric invariably slips.
- Chasing vanity metrics: Tracking high impression counts that generate zero revenue creates a false sense of security.
For further reading on maintaining data integrity standards, consult guidelines provided by the Data Governance Institute for structuring enterprise information flows.
Frequently Asked Questions
How often should control panel metrics be updated?
Update frequency depends entirely on the operational speed of the metric. Financial reconciliations might only need monthly updates, while website traffic or server load requires real-time or hourly feeds. Match the refresh rate to how quickly you need to react.
What is the difference between a vanity metric and an actionable metric?
A vanity metric looks impressive on a report—like total lifetime app downloads—but doesn't tell you if the business is healthy. An actionable metric—like active daily users or customer churn rate—directly informs a specific operational decision.
How do I get my team to adopt new analytics tools?
Adoption stalls when tools are overly complex or disconnected from daily workflows. Involve the end users during the design phase, ensure the interface answers their specific daily questions, and provide brief training sessions focused on practical execution.
How many metrics should appear on a single display?
Limit your primary view to between five and nine core indicators. If users need to scroll extensively or squint to read data points, the interface is too crowded and needs simplification.