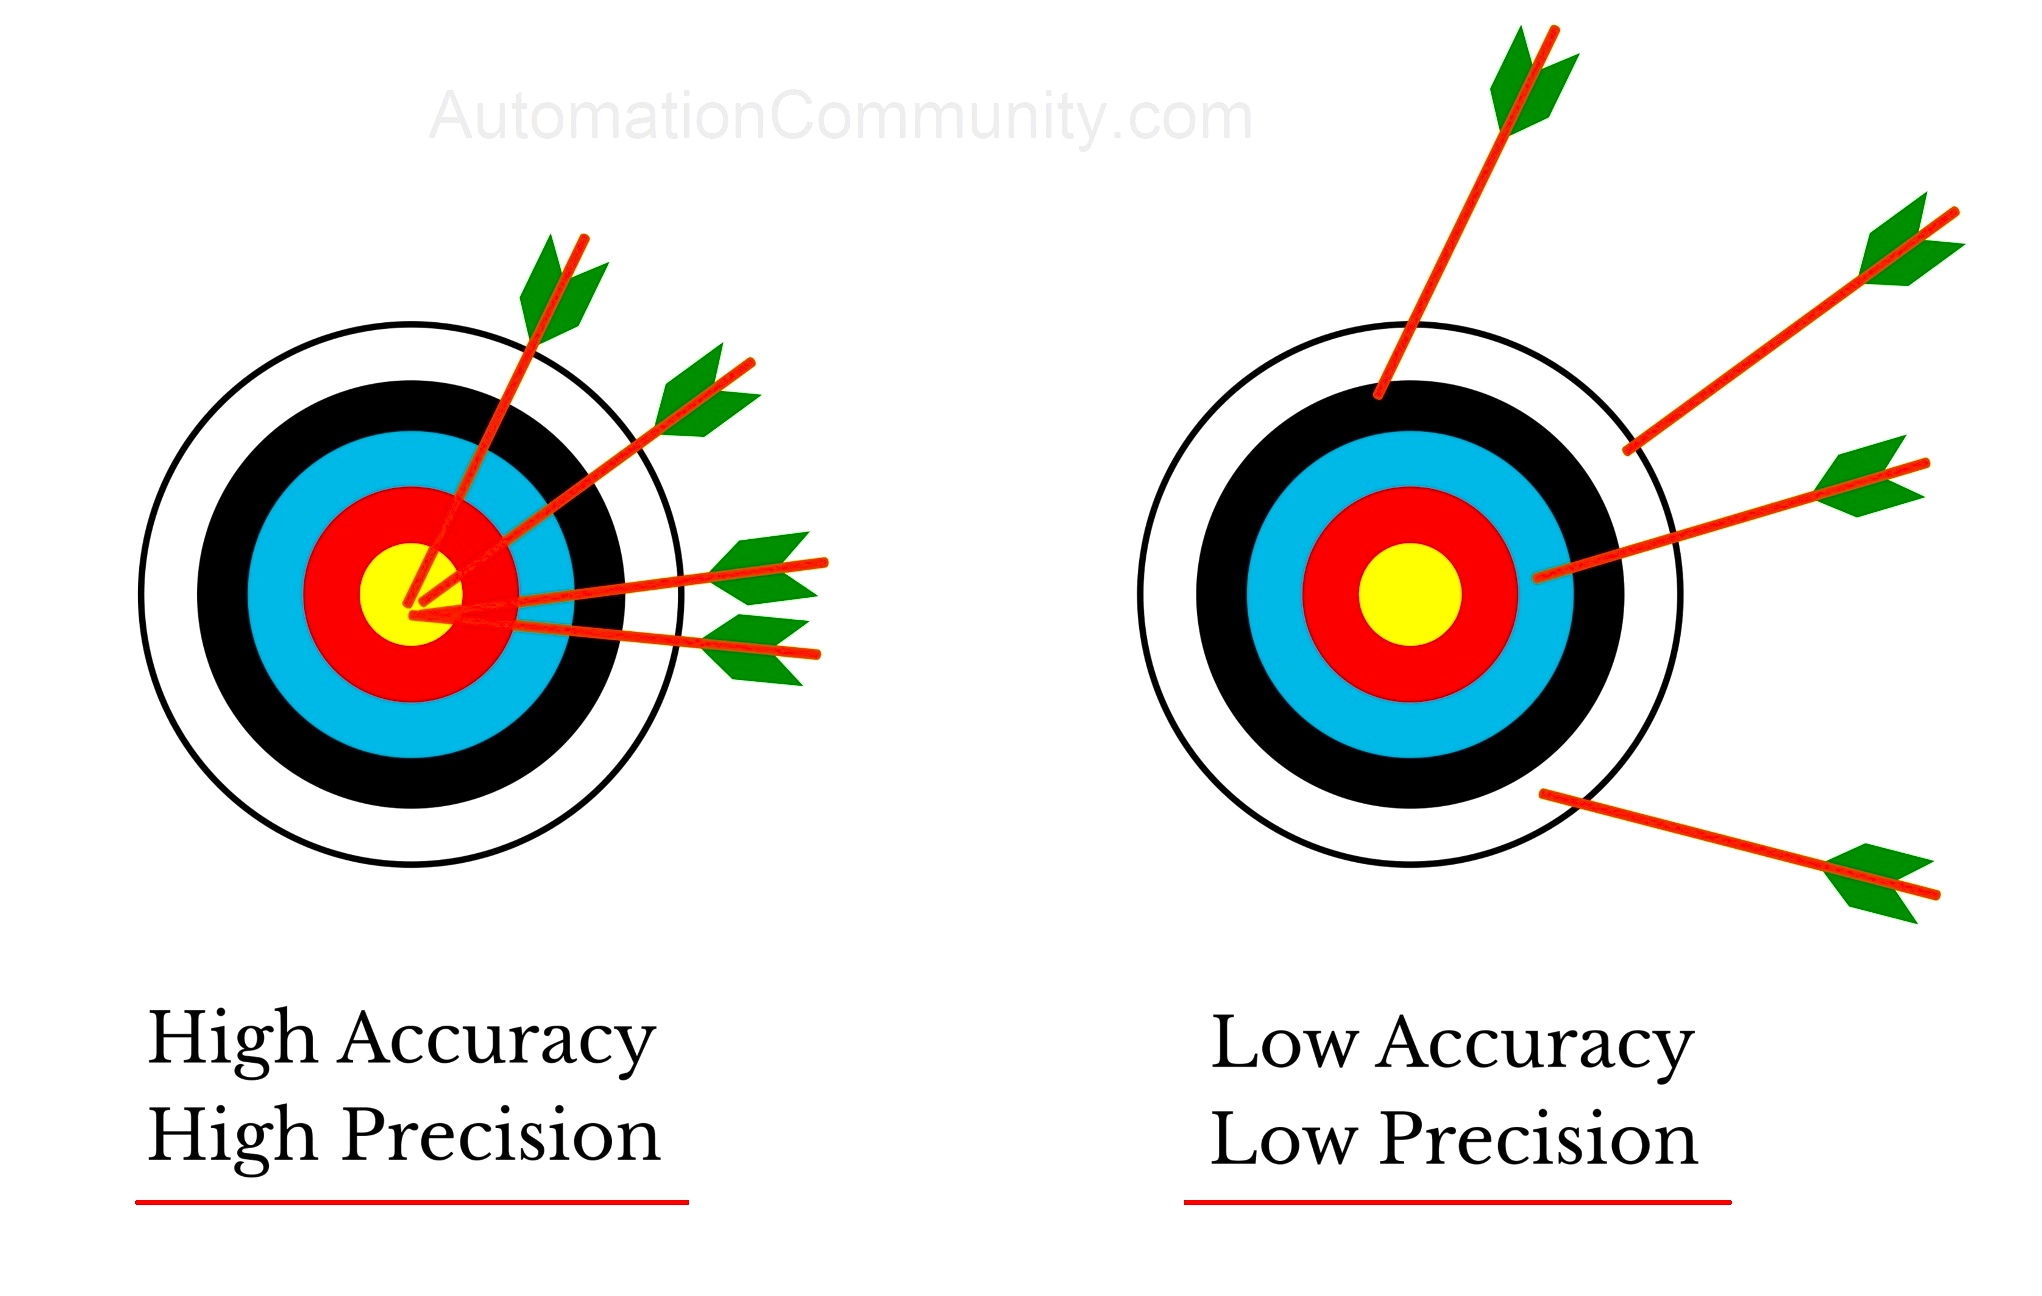
Making major strategic choices based on flawed internal metrics is like navigating a ship with a broken compass. You might feel like you're moving forward, but you could be heading straight for the rocks. Most executives assume their dashboard figures are correct because the reports look clean. Yet, hidden calculation errors, vanity metrics, and siloed data sources routinely distort operational realities.
To evaluate whether your organization's figures are reliable, leaders must look past polished slide decks and interrogate how numbers are collected, defined, and utilized. Let's examine the critical inquiries every decision-maker needs to direct at their operational data.
Where Does the Data Originate and Who Owns It?
Data accuracy starts at the collection point. If the initial input is flawed, every downstream calculation, forecast, and executive decision inherits that error. Leaders need to trace every core metric back to its source.
Ask your teams how raw data enters your systems. Is it entered manually by employees rushing to finish tasks, or is it captured automatically via integrated software? Manual entry introduces human error, typos, and confirmation bias.
- Identify single points of failure: Determine if a single person or department controls a critical data stream without cross-verification.
- Inspect data definitions: Ensure different departments aren't using the same term to mean completely different things. For example, does marketing define a "qualified lead" the same way sales does?
- Establish clear ownership: Every core metric needs a designated data steward responsible for its accuracy and consistent tracking over time.
When definitions vary across departments, organizational alignment breaks down. Fixing data accuracy requires standardizing vocabulary before looking at the numbers themselves.
Are You Tracking Leading Indicators or Lagging Outputs?
Many management teams spend hours reviewing metrics that record what already happened, offering zero opportunity to change the outcome. Financial P&L statements, monthly churn rates, and quarterly revenue totals are classic lagging indicators. They tell you where you've been, not where you're going.
A reliable metrics framework balances lagging outcomes with predictive leading indicators. If you want to know if next quarter's revenue target is realistic, looking at past sales totals won't help. You need to inspect early-stage pipeline velocity, customer engagement scores, and inbound inquiry trends.
- Shift review meetings from looking backward at historical spreadsheets to analyzing forward-looking pipelines.
- Test whether your current leading indicators actually correlate with future success or if they're just easy metrics to measure.
- Cut metrics that don't change behavior or inform upcoming choices.
According to research from MIT Sloan Management Review, organizations that focus on actionable, forward-looking analytics outperform peers who remain buried in static historical reporting.
How Often Are Assumptions Audited?
Every financial model, customer lifetime value calculation, and operational forecast relies on foundational assumptions. Over time, market conditions shift, customer behaviors evolve, and those underlying assumptions quietly expire.
If your cost-per-acquisition or inventory turnover models haven't been reviewed against actual market realities in the past year, your figures are likely built on outdated math.
- Document every assumption baked into your primary business models.
- Schedule regular stress tests to see how small changes in external variables impact your projections.
- Compare forecasted outcomes against actual results quarterly to spot chronic estimation drift.
Are Vanity Metrics Masking Underlying Problems?
It's easy to fall in love with numbers that always go up, even when those figures have little bearing on business health. Total registered users, website page views, and social media impressions often act as classic vanity metrics. They look impressive in board presentations while masking stagnant revenue or high customer churn.
True leadership requires stripping away feel-good numbers to focus on unit economics and operational efficiency. If total user acquisition is rising while active daily usage and net revenue retention flatline, your growth metrics are misleading you.
How to Build a Culture of Radical Data Transparency
Fixing flawed numbers isn't just about software upgrades or new spreadsheet templates; it requires cultural change. If teams feel penalized for reporting bad news, they will naturally massage the numbers to protect themselves.
- Reward honest reporting of missed targets over creative spreadsheet adjustments.
- Create open forums where teams can question anomalies in public dashboards without fear.
- Implement regular data audits where cross-functional groups inspect reporting pipelines together.
For broader insights on establishing organizational governance standards, review guidelines provided by the Data Governance Institute. When teams know that data integrity is valued above pleasant-sounding reports, accuracy naturally improves.
Frequently Asked Questions
What causes most business data to become inaccurate over time?
Data decay typically happens due to manual entry errors, changing business processes that aren't updated in tracking systems, software integration breaks, and shifting departmental definitions of key terms.
How can leaders spot vanity metrics on their dashboards?
If a metric increases consistently but does not correlate with improved cash flow, customer retention, or direct operational output, it is likely a vanity metric that should be deprioritized.
How often should a company audit its core performance metrics?
Core metrics and financial models should undergo a light review every quarter, with a comprehensive audit of underlying formulas, data sources, and assumptions performed annually.
What is the difference between a leading and a lagging indicator?
Lagging indicators measure historical results, such as last month's revenue. Leading indicators measure activities that predict future results, such as customer onboarding completion rates or early sales pipeline volume.