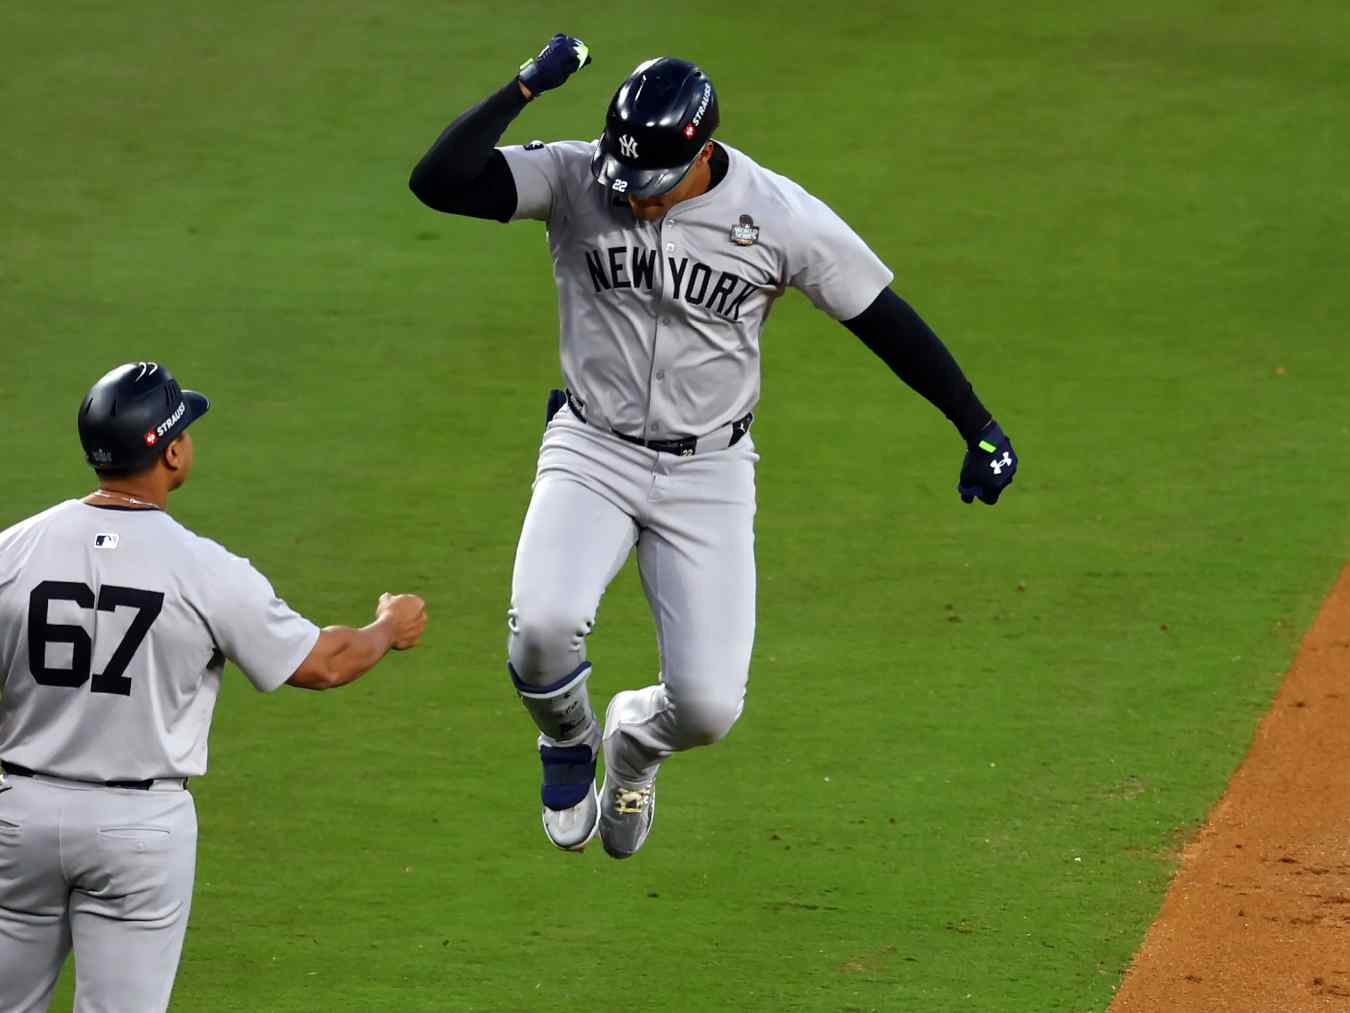
Every baseball game comes down to a fundamental duel: the individual batter versus the pitcher standing sixty feet and six inches away. This micro-matchup dictates the rhythm of the game, influencing managerial decisions, roster construction, and high-stakes betting strategies. While fans often focus on macro statistics like team standings or seasonal home run totals, the true tactical chess match happens pitch by pitch between two athletes trying to outsmart one another.
Evaluating this dynamic requires looking beyond basic box scores to understand the physical mechanics, psychological adjustments, and advanced data metrics that drive success on the diamond. Whether you're tracking fantasy sports, analyzing team strategy, or trying to understand how modern hitting approaches have evolved against velocity-heavy pitching, breaking down the mechanics of the duel reveals how dominance is won or lost.
The Anatomy of the Duel
The confrontation begins long before the first pitch crosses home plate. Pitchers and hitters spend hours reviewing video files, studying tendencies, and preparing game plans based on past meetings, spray charts, and scouting reports provided by organizations like MLB. When the player steps into the batter's box, fractions of a second determine the outcome.
A major league fastball travels from the pitcher's hand to the plate in roughly four-tenths of a second. Human visual processing and muscular reaction times mean a hitter must commit to a swing before the ball is even halfway to home plate. Because direct reaction is nearly impossible at elite velocities, hitters rely on pattern recognition, timing mechanisms, and anticipation.
Pitchers exploit this biological limitation by sequencing pitches to disrupt timing and eye levels. By pairing a high-90s fastball with a sinking changeup or a biting slider that starts in the strike zone and finishes outside, a pitcher manipulates the hitter's perception. The battle becomes a test of who can impose their preferred zone: the pitcher trying to expand the strike zone, or the hitter hunting a specific pitch in a specific location.
Understanding Platoon Splits and Handedness
One of the most reliable indicators of advantage in any matchup is the handedness of both participants. Historically, baseball strategy relies heavily on platoon splits—the statistical variance in performance depending on whether a batter and pitcher share the same side of the plate.
When a right-handed batter faces a right-handed pitcher, or a lefty faces a lefty, the pitcher generally holds a baseline advantage. The ball tunnels from a release point that appears to originate closer to the batter's body or breaks away from their barrel. Conversely, facing an opposite-handed pitcher allows the hitter to pick up the ball's rotation out of the hand more cleanly and keeps the outer half of the plate accessible for extended contact.
Modern analytics take this concept much further using detailed pitch tracking data found on platforms like FanGraphs. Analysts look at how specific batters handle breaking balls moving away from them compared to fastballs running in on their hands. Some hitters buck conventional platoon splits entirely, mastering same-sided pitching through elite bat speed and coverage of the inner half.
The Pitfalls of Small Sample Size BvP Stats
One of the most common errors analysts and fans make is placing too much weight on historical batter-versus-pitcher data when the sample size is too small. If a hitter goes 3-for-4 with a home run against a specific starting pitcher over their careers, casual observers often assume a guaranteed success. In reality, four at-bats represent statistical noise rather than a meaningful trend.
Meaningful evaluation requires filtering for a larger sample threshold, typically at least fifteen to twenty career plate appearances, before historical head-to-head numbers carry predictive weight. Even then, pitchers evolve. A pitcher who relied heavily on a four-seam fastball three years ago may have added a sweeping slider or changed their arm slot last season, rendering old head-to-head metrics obsolete.
Smart evaluations combine historical numbers with current context:
- Check current pitch mix frequencies to see if the pitcher still throws the types of pitches the batter handles well.
- Evaluate recent hot or cold streaks rather than relying solely on multi-year baselines.
- Factor in ballpark dimensions and environmental factors like wind direction, which can turn routine fly balls into home runs.
Advanced Metrics That Reveal True Dominance
Traditional statistics like batting average and earned run average fail to capture the nuances of modern pitching and hitting. To measure true dominance, analysts turn to metrics that isolate individual performance from defensive support and ballpark quirks.
For pitchers, Fielding Independent Pitching measures what a pitcher can control directly: strikeouts, walks, hit-by-pitches, and home runs. By stripping out the defense's ability to catch balls in play, FIP offers a clearer picture of pitcher skill. Expected statistics, such as expected slugging percentage and expected weighted on-base average, utilize exit velocity and launch angle data to evaluate the quality of contact a pitcher allows, filtering out bad luck or fortunate defensive positioning.
For hitters, chase rate and whiff rate provide insight into plate discipline. A dominant hitter doesn't just crush mistakes; they control the strike zone by laying off pitches outside the zone and punishing offerings in their hot zones. When a high-strikeout power hitter faces an elite control pitcher who avoids the heart of the plate, the contest shifts to an endurance test of patience and discipline.
Frequently Asked Questions
What does BvP mean in baseball analysis?
BvP stands for batter versus pitcher. It refers to the historical statistical record of how a specific hitter has performed against a specific pitcher across all past plate appearances. While useful for context, analysts caution against relying on small sample sizes.
Why do managers care so much about platoon splits?
Platoon splits give a clear mathematical advantage based on the geometric angles of the delivery. Hitters generally see the ball better against pitchers throwing from the opposite arm side, making managers eager to deploy pinch-hitters or left-right matchups in late-inning high-leverage spots.
How do modern hitters prepare for velocity?
With average fastballs climbing across professional leagues, hitters use high-speed pitching machines in training facilities, study pitcher release points on video, and adjust their swings to shorten their paths to the ball, prioritizing quick hands over long, looping power swings.
Can a hitter overcome a bad matchup through preparation?
Yes. Hitters often study scouting reports to identify a pitcher's primary tendency in an initial count, allowing them to sit on a specific pitch type rather than reacting blindly to raw velocity. Game planning and situational awareness help bridge the gap against tough opponents.