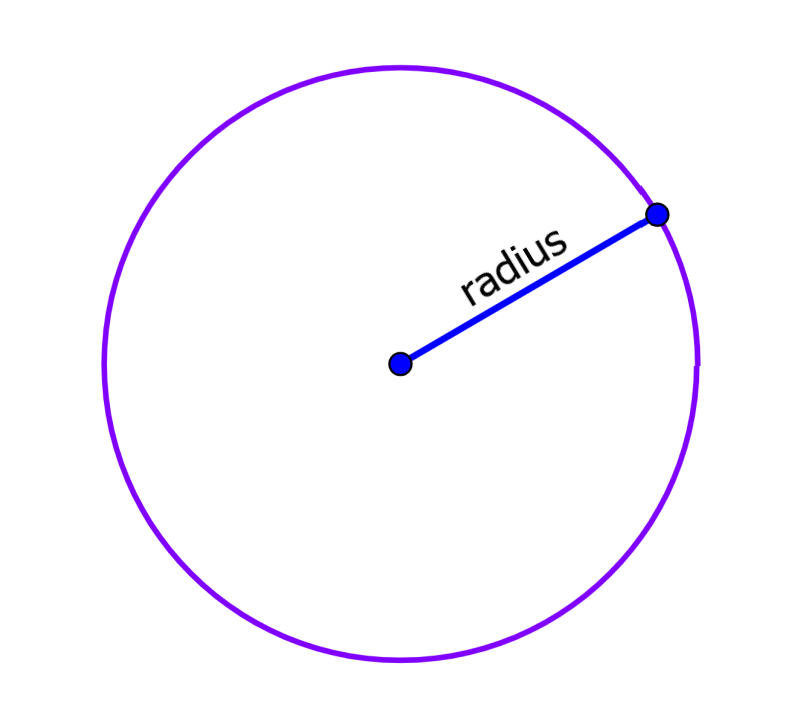
Mastering trade areas starts with geographic intelligence. When opening a new storefront, launching targeted advertising, or auditing market saturation, knowing what exists right around your assets determines whether you thrive or stall. A radius map provides this clarity by drawing exact concentric circles around a specific coordinate to visualize everything within designated distances.
While executives once relied on intuition and basic maps, modern geospatial tools allow companies to dissect their surrounding markets with precision. Breaking analysis down into 1, 3, and 5 mile increments reveals distinct behavioral zones that dictate how customers interact with physical locations. Analyzing these specific tiers transforms raw address data into a strategic asset.
What Is a Radius Map and How It Works
A radius map is a visual representation created by drawing circular boundaries around a central point, such as a retail storefront, warehouse, or service headquarters. These circles represent Euclidean distance—straight-line measurements from the center point outward.
[Storefront Center]
       │
       ├─── 1-Mile Circle (Walkable / Immediate Catchment)
       ├─── 3-Mile Circle (Standard Drive / Core Trade Area)
       └─── 5-Mile Circle (Regional Draw / Extended Market)
Geographic information systems combine coordinate data with spatial layers to build these visual zones. Analysts set a central marker, choose distance units, and generate rings. This creates a standardized unit of measurement that allows multi-unit operators to compare store performance across different cities on an equal footing.
The 1-Mile Radius: Capturing Immediate Foot Traffic
The one-mile ring represents the most immediate catchment zone for any urban or suburban business. In dense environments, this boundary captures foot traffic, quick errands, and convenience-driven visits.
For quick-service restaurants, specialty coffee shops, and dry cleaners, the 1-mile radius often holds the majority of daily active users. People rarely travel far for routine, low-ticket purchases. Mapping this tight zone uncovers immediate residential density, competing storefronts, and local pedestrian bottlenecks.
- Core demographic: Pedestrians, apartment dwellers, and neighborhood locals.
- Primary consumer motivation: Ultimate convenience and speed.
- Key risk: High local market saturation and steep commercial lease costs.
When evaluating a one-mile ring, analysts look closely for physical barriers like major highways or railway lines that might block foot traffic from crossing over, even if the distance looks short on paper.
The 3-Mile Radius: Defining the Core Trade Area
Expanding outward to a three-mile boundary captures the standard driving distance for routine weekly errands, medical visits, and mid-tier retail shopping. This zone is typically considered the core trade area for supermarkets, fitness centers, and casual dining establishments.
Customers are willing to get in their cars and drive a few minutes if the destination offers better pricing, superior selection, or specialized services. Within this three-mile circle, demographic data reveals household income tiers, family size, and commuting habits that highlight potential repeat business.
- Core demographic: Suburban drivers and suburban homeowners.
- Primary consumer motivation: Balanced value, quality, and accessibility.
- Key risk: Minor traffic bottlenecks or poor arterial road connections that slow down travel times.
Retailers use this middle tier to measure brand penetration. If customer loyalty card data shows low adoption from the outer edge of the three-mile ring, marketing teams know they need to adjust local ad targeting.
The 5-Mile Radius: Measuring Regional Reach
The five-mile boundary represents an extended trade area. This zone is essential for destination retail, large grocery superstores, car dealerships, and entertainment venues that draw from multiple neighborhoods or neighboring suburbs.
At this scale, consumers plan their trips ahead of time. They aren't stopping in on a whim; they are making a deliberate journey. Analyzing a 5-mile radius gives regional operators a clear picture of broader market share, regional competition, and logistics coverage zones for delivery fleets.
- Core demographic: Regional commuters, suburban shoppers, and destination visitors.
- Primary consumer motivation: Specialized inventory, unique experiences, or bulk value.
- Key risk: Cannibalization between your own neighboring branch locations if rings overlap too aggressively.
For home service providers, such as HVAC technicians or residential contractors, a 5-mile radius often defines the edge of profitable dispatch times before fuel and travel overhead eat into profit margins.
Layering Data for Advanced Insights
Plain rings on a map only show distance, not reality. To unlock true business intelligence, analysts overlay multiple data sets onto the 1, 3, and 5 mile rings.
Demographic and Psychographic Overlays
Dropping age distribution, household income levels, and spending habits into each ring stops guesswork. A retailer selling premium cookware needs to see high disposable income within the 3-mile ring, not just high population density.
Traffic Patterns and Infrastructure
Straight-line distance can be deceptive. A river, a freight rail line, or a limited-access highway can cut a 1-mile ring in half. Layering actual traffic flow data and road networks ensures that your geographic analysis reflects how people actually move through a city.
Competitor Proximity Mapping
Plotting competing brands within the same rings highlights market gaps. If your 3-mile ring contains three direct competitors but zero market presence on the northern side, you've identified an underserved expansion pocket.
According to the U.S. Small Business Administration, understanding local market dynamics and customer density is a foundational step for retail viability and long-term risk mitigation. Similarly, municipal planning guidelines often reference geographic catchment areas when reviewing commercial zoning permits, as outlined by the American Planning Association.
Common Mistakes in Radius Analysis
Relying entirely on simple circles without factoring in human behavior leads to costly miscalculations. Avoid these common strategic errors:
- Treating all miles equally: A 1-mile walk downtown feels very different from a 1-mile drive down a rural two-lane highway. Always adjust for local terrain.
- Ignoring natural barriers: Assuming customers travel in a perfect circle ignores rivers, steep hills, and gated communities that block direct paths.
- Failing to test multiple radii: Relying on a single arbitrary distance hides how customer behavior actually shifts across different thresholds.
- Neglecting drive-time alternatives: While radius maps measure distance, combining them with drive-time polygons provides a much more accurate picture of accessibility.
Frequently Asked Questions
How do I choose the right radius size for my business?
Match your distance to your customer's intent. If you sell daily coffee, focus heavily on a 1-mile radius. If you sell furniture or specialty appliances, a 5-mile or even 10-mile trade area is much more appropriate.
Are radius maps better than drive-time maps?
They serve different purposes. Radius maps offer quick, standardized comparisons across hundreds of locations. Drive-time maps account for actual road networks and speed limits, providing more realistic travel accessibility for specific regions.
Can small businesses use radius mapping without expensive software?
Yes. Many accessible geographic tools and mapping platforms let users drop a pin and draw custom rings around an address to check basic population counts and local business density.
Why do companies use 1, 3, and 5 mile increments specifically?
These three increments correspond directly to established consumer travel habits: walking distance for immediate needs, short driving distance for routine errands, and regional travel for major purchases.


